Study · Kresmion Research
A Week Before Resolution, How Well Does the Crowd Price Prediction Markets?
Published by Kresmion Research. Read our editorial approach and data methodology.
# A Week Before Resolution, How Well Does the Crowd Price Prediction Markets?
A week before a Polymarket contract settles, how close are its prices to what happens? Kresmion Research took the last snapshot recorded at least seven days before each resolved market's end date and compared its implied YES probability to the outcome. We went looking for the textbook "favorite-longshot bias" (longshots overpriced, favorites underpriced) and the crowd mostly passed. Across 1,377 resolved markets the Brier score (a standard accuracy measure where zero is perfect and lower is better) was 0.0066 against 0.1995 for base-rate guessing, a Brier Skill Score of about 0.967. The one place the classic bias is statistically visible is the extreme longshot tail, not the middle.
In the middle, where the bias would be easiest to trade, our point estimates lean that way: markets priced 10 to 60 percent resolved YES 17 percent of the time against 26 percent implied. But with only 46 markets the shortfall sits inside sampling error and stops leaning under a genuine one-week snapshot, though 20 markets cannot settle it. So we cannot confirm a systematic mid-range bias here. This is one venue over about ten weeks, and past patterns need not repeat. You can watch the question resolve on Kresmion's live calibration page.
Key takeaways
| Question | What the data shows |
|---|---|
| Well calibrated overall a week out? | Yes. Brier 0.0066 versus 0.1995 for base-rate guessing, a Brier Skill Score of about 0.967 (it removes about 97 percent of the base-rate error). |
| Where is the favorite-longshot bias visible? | Only in the extreme sub-1 percent tail. Of 958 markets priced near 0.67 percent, 1 resolved YES against 6.38 expected; the exact interval excludes the implied price (P(X<=1)=0.012). |
| Are mid-range longshots (10 to 60 percent) overpriced? | Not confirmed. 8 of 46 resolved YES (17.4 percent) versus 26.0 percent implied; the exact interval contains the implied average (P=0.109). |
| Does a true one-week horizon change the mid-band? | The point estimate stops leaning (5 of 20 YES, 25.0 versus 25.6 percent implied), but 20 markets cannot confirm calibration. |
| Do these numbers describe all of Polymarket? | No. Only 32.7 percent of resolved markets carry a settled label, and this runs on a narrower slice still. |
What "calibration" means
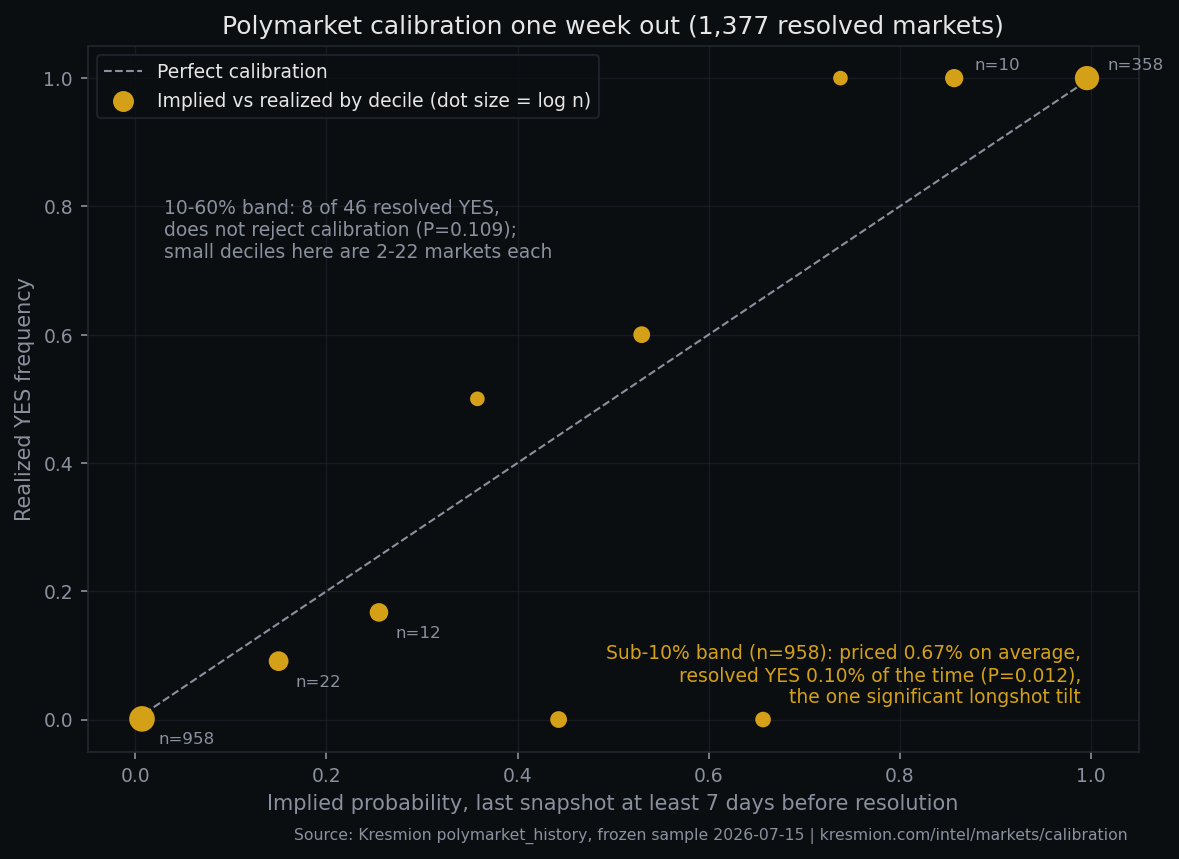
A set of forecasts is calibrated if the things it prices at 30 percent happen close to 30 percent of the time; it is a property of the whole set, not any single market. On the reliability diagram, perfect calibration sits on the diagonal, and the favorite-longshot bias is not a sag in the middle but an antisymmetric rotation about roughly 0.5: low-probability longshots fall below the diagonal (they resolve YES less often than priced) while high-probability favorites rise above it (more often than priced), crossing near the middle. Our band table shows that shape, the 70 to 100 percent bins all resolving at or above their prices. Calibration is also not accuracy: the Brier score (Brier, 1950) squares each market's gap between price and outcome, so a near-zero Brier at the extremes mostly reflects how often the crowd is simply right, not whether a price matches its long-run frequency.
The overall picture: excellent, but carried by easy markets
Our benchmark is climatology, not a coin flip: scoring the sample's own YES rate (27.5 percent) on every market gives 0.1995. The crowd's 0.0066 is a Brier Skill Score of about 0.967, removing roughly 97 percent of the error of base-rate guessing. We quote the skill score rather than a raw ratio because the Brier score is a squared-error measure, so "thirty times lower" is not a linearly interpretable statement. And the score is flattered by an easy sample: 1,316 of the 1,377 markets sit in the outer deciles (under 10 percent or at 90 percent and above) and almost all resolve as priced. A low Brier here mostly says most markets are already obvious a week out; the informative test is the thin middle.
| Implied YES band | Markets | Avg implied | Realized YES |
|---|---|---|---|
| 0 to 10% | 958 | 0.7% | 0.1% |
| 10 to 20% | 22 | 15.0% | 9.1% |
| 20 to 30% | 12 | 25.5% | 16.7% |
| 30 to 40% | 2 | 35.8% | 50.0% |
| 40 to 50% | 5 | 44.3% | 0.0% |
| 50 to 60% | 5 | 53.0% | 60.0% |
| 60 to 70% | 3 | 65.7% | 0.0% |
| 70 to 80% | 2 | 73.8% | 100% |
| 80 to 90% | 10 | 85.7% | 100% |
| 90 to 100% | 358 | 99.6% | 100% |
The middle deciles are thin and jumpy, not a clean slope: the 40 to 50 percent bin resolved YES zero times while the 50 to 60 percent bin resolved 60 percent.
The one real longshot signal: the sub-1 percent tail
The single place the favorite-longshot bias is statistically significant here is the extreme tail: the 958 markets priced under 10 percent, averaging an implied 0.67 percent, the canonical longshot zone. One resolved YES against 6.38 expected under their own prices. The exact Poisson-binomial probability of one or fewer YES if those prices were right is 0.012, and the Clopper-Pearson interval on the realized rate, [0, 0.58 percent], excludes the 0.67 percent implied. That is a genuine tilt in the favorite-longshot direction, but three caveats keep it in proportion. The magnitude is tiny, 0.67 percent priced against 0.10 percent realized, not a tradeable gap. It is plausibly a microstructure artifact: a price floor or minimum tick at the edge of the book keeps quotes from reaching zero, which alone would leave near-certain-NO longshots printing a hair above their true frequency. And the near-zero Brier here reflects accuracy, not calibration, which is why it stays minuscule even though the tail is mildly miscalibrated. The signal does survive the one-week horizon cut (P(X<=0)=0.027 within 14 days), so it is not only a stale-price effect, but it is small and mechanically suspicious; we present it as the one detectable miss, not a headline.
The middle of the range: a lean, not a confirmed bias
Pooling the 10 to 60 percent band into one pre-registered test gives 46 markets. Eight resolved YES, a realized 17.4 percent against an average implied 26.0 percent, the direction the bias predicts but well inside what chance can produce.
| Measure | Value |
|---|---|
| Markets priced 10 to 60 percent | 46 |
| Resolved YES | 8 |
| Realized YES rate | 17.4% |
| Average implied probability | 26.0% |
| Exact 95% interval on realized rate | 7.8% to 31.4% (contains 26.0%) |
| One-sided exact p-value (calibration null) | 0.109 |
| Same band, snapshots within 14 days | 20 markets, 25.0% realized versus 25.6% implied |
The exact 95 percent interval runs from 7.8 to 31.4 percent and contains the 26.0 percent implied average; the one-sided probability of 8 or fewer YES under perfect calibration is 0.109. Our pre-registered falsification rule was explicit: if the realized frequency matched the implied average within exact sampling error, we would not claim a bias. It matched, the falsification test was not triggered, and we do not reject calibration. The non-rejection rests on few resolutions: crossing the 0.05 line would have needed two fewer YES (6 gives 0.022, 7 gives 0.053, the observed 8 gives 0.109), and more YES push it further from significance.
Does the tilt survive a true one-week horizon?
The "at least seven days out" rule is a floor. Across the whole sample the median snapshot was 8 days before resolution and 61 percent fell within 10 days, but the mean was 34 and the maximum 607, because some crypto and price-bin contracts carry far-future placeholder end dates and resolve early; inside the 46 mid-band markets it is extreme, median gap 17.5 days, mean 171. Two cuts probe whether the lean is just early, pre-convergence pricing, and they disagree. By horizon, the 26 markets scored more than 14 days out realized 11.5 percent versus 26.2 percent implied, while the 20 within 14 days realized 25.0 percent versus 25.6 percent implied; under that one-week horizon the point estimate no longer leans, but with 20 markets the interval runs roughly 8.7 to 49.1 percent, so this cut cannot confirm calibration either. By liquidity the sign flips: among mid-band markets with at least 10,000 dollars of volume, all horizons, 1 of 21 resolved YES (P(X<=1)=0.021, which does reject), while the same markets within 14 days give 1 of 13 (P=0.144, which does not). If the lean were purely an artifact of scoring prices too early, the more liquid markets should show less tilt, not more. They show more. So we report both cuts and stop short of the clean story that the shortfall is simply stale early pricing.
The favorite-longshot bias in context
Snowberg and Wolfers (2010) define the favorite-longshot bias as the regularity that "longshots are overbet, while favorites are underbet," documented in racing and sports betting; the label is an analogy for Polymarket, not the same dataset. An independent preprint, Le (2026), analyzes 292 million trades across 327,000 Polymarket and Kalshi contracts and reports prices "chronically compressed toward 50 percent," an underconfidence pattern that generalizes across both venues; that is the same direction as a favorite-longshot tilt, so we read it as convergent evidence, not validation of our numbers. Fees do not explain it either: Polymarket's fees are symmetric, so they cannot lift mid-range prices while leaving the extremes near their marks.
Methodology and sources
Kresmion Research uses Kresmion's `polymarket_markets` and `polymarket_history` tables. From every market flagged resolved with a settled YES or NO label and a non-null end date, we take the last snapshot whose calendar date is at least seven days before it (`recorded_at::date <= end_date - 7`) and read its implied YES probability. We score each against its outcome (YES equals 1, NO equals 0) with the Brier score and group markets into bands comparing average implied against realized YES frequency, also reporting a variant requiring the snapshot within 14 days and flagging far-future placeholder end dates. Uncertainty uses exact Clopper-Pearson intervals and, for the calibration tests, the exact Poisson-binomial probability under the null of perfect calibration. This reconstruction ran on 2026-07-15 at 19:54 UTC against the live database, covering 1,377 labeled markets with price history from 2026-04-30 to 2026-07-15 (about 10.5 weeks). "One week" is a floor, not the typical horizon: the median snapshot gap is 8 days and 61 percent of snapshots fall within 10 days. Because the database is live and labels arrive continuously, counts shift between runs, so we freeze and date the query. Methodology notes: /about/methodology. Coverage: /intel/polymarket and current odds at /odds. A companion piece covers how prediction markets price the Fed.
Limitations
- Selection. Only 10,615 of 32,486 resolved markets (32.7 percent) carry a settled YES or NO label; the other 21,871 are marked resolved with an empty label and excluded, and roughly 18,800 of them sit in the informative 0.10 to 0.90 middle we characterize. The 1,377 scored markets are about an eighth of that labeled subset, also needing price history in our ten-week window and a snapshot at least seven days out. Findings describe this top-volume-tracked, label-available subset, not Polymarket as a whole.
- A thin, non-independent middle. The mid-range signal rests on 46 markets that are not 46 independent questions. The band is dominated by near-duplicate template families (post-count bins, valuation ladders, price-dip bins), and event_id is null on every row, so we cannot cluster by event. Non-independence does not point cleanly one way: nested or duplicate markets (positive dependence) would widen the true intervals, while mutually exclusive siblings (negative dependence) would tighten them. Either way, 46 overstates how much independent information the band carries.
- Short window, single venue. History spans only about ten weeks, over-representing short-dated markets, and everything comes from one venue and one price field, so "implied probability" is a mid-style quote, not a tradeable, fee-inclusive price.
FAQ
Does a low Brier score mean the crowd is smart?
Not by itself. Calibration is necessary but not sufficient, and it is not accuracy: a forecaster who always predicts the base rate is trivially calibrated yet useless, and a near-zero Brier at the extremes mostly reflects how often the answer was obvious. Judge skill by the skill score (about 0.967) and the reliability diagram together, not the raw Brier alone.
Can I use this to make money on mispriced longshots?
No. This is historical statistics, not advice, and there is no confirmed tradeable edge: the mid-range shortfall is within sampling error, and the one significant tilt, at the sub-1 percent tail, is a fraction of a percent wide and plausibly a price-floor artifact. Capturing any lean means locking capital until resolution against wide spreads and fees, so after frictions there is no free money.
Why did an earlier cut look like a clear bias?
An earlier pass used a timestamp boundary that quietly demanded eight full days rather than seven and did not cap the horizon, loading the sample with early, pre-convergence prices. The frozen, calendar-correct version does not reject calibration on the pre-registered test, though a liquidity-restricted slice still does.
Sources
- Brier, G. W. (1950). Verification of forecasts expressed in terms of probability. Monthly Weather Review 78(1), 1 to 3. Link
- Snowberg, E. and Wolfers, J. (2010). Explaining the favorite-longshot bias: is it risk-love or misperceptions? Journal of Political Economy 118(4), 723 to 746. Link
- Wolfers, J. and Zitzewitz, E. (2004). Prediction markets. Journal of Economic Perspectives 18(2), 107 to 126. Link
- Le, N. A. (2026). Decomposing crowd wisdom: domain-specific calibration dynamics in prediction markets. arXiv:2602.19520 (preprint). Link
- Polymarket documentation: fees and resolution.
_Kresmion Research. Figures frozen 2026-07-15 19:54 UTC against the live database. Historical statistics only, not investment advice; past patterns need not repeat._
- · Brier, G. W. (1950). Verification of forecasts expressed in terms of probability. Monthly Weather Review 78(1):1-3. https://journals.ametsoc.org/view/journals/mwre/78/1/1520-0493_1950_078_0001_vofeit_2_0_co_2.xml
- · Snowberg, E. and Wolfers, J. (2010). Explaining the Favorite-Longshot Bias. Journal of Political Economy 118(4):723-746. https://www.nber.org/papers/w15923
- · Wolfers, J. and Zitzewitz, E. (2004). Prediction Markets. Journal of Economic Perspectives 18(2):107-126. https://www.aeaweb.org/articles?id=10.1257/0895330041371321
- · Le (2026). Decomposing Crowd Wisdom: Domain-Specific Calibration Dynamics in Prediction Markets. arXiv:2602.19520 (preprint). https://arxiv.org/abs/2602.19520
- · Polymarket fee documentation. https://docs.polymarket.com/trading/fees
- · Polymarket resolution documentation. https://docs.polymarket.com/concepts/resolution
Current Polymarket and Kalshi prices, with order-book depth and the execution cost of a given size.
Free to view, no account needed.
Put this to work
Real filings, 13F flows, and positioning reads with the source on every number, in your inbox when there is something in the data, or live on Telegram. Free, no account.
No fixed schedule: it goes out when the data has something in it. Unsubscribe anytime.
Kresmion publishes information, not investment advice. See our methodology and the latest research notes.