Research Notes
Speculators Hold One of Their Biggest Natural Gas Bets in a Year. Since They Piled In, the Price Has Fallen Nearly 11 Percent.
Published by Kresmion Research. Read our editorial approach and data methodology.
By Kresmion Research, July 18, 2026
Speculators have spent the past year building one of the largest long bets in the natural gas market. As of the July 7 Commitments of Traders report, the CFTC's non-commercial traders held a net long position equal to about 65 percent of all open interest in the benchmark contract, the 98th percentile of the past 52 weeks and near the highest reading in that window. It is one of the most crowded speculative long positions across every futures market Kresmion tracks.
The price has not cooperated. In the eleven days since that snapshot, front-month gas has fallen from about 3.27 dollars per million British thermal units to roughly 2.91, a drop of nearly 11 percent, even as a heat wave lifted power demand and the largest US grid operator posted its widest capacity shortfall yet. The people positioned for scarcity, and the grid warning of it, are both looking at the same commodity whose price keeps drifting lower. This note lays out the three readings that disagree, the one number that reconciles them, and the reasons the setup could resolve either way. It is a description of what happened, not a forecast and not advice.
The most crowded corner of the futures tape
Kresmion tracks speculative positioning across 13 major futures markets through the weekly CFTC report. Going into this week, four of them sat at genuine extremes: Bitcoin, the S&P 500 E-mini, the euro, and natural gas. Gas is the commodity in that group, and its long side is unusually one-directional.
In the report covering the week through July 7, released July 10, non-commercial traders held a net long position of 253,788 contracts against total open interest of 389,405. That net long alone is 65.2 percent of the entire open interest in the contract. Against the trailing 52 weeks of the same series, it registers in the 98th percentile, a hair below the prior week's reading and part of a cluster of six straight weeks above 64 percent.
| CFTC non-commercial net long, natural gas | Net long as percent of open interest |
|---|---|
| A year ago (early May 2025) | about 54 percent |
| Late winter (February 2026) | about 57 to 58 percent |
| Spring (April 2026) | about 61 to 63 percent |
| Six weeks ago (early June 2026) | about 65 percent |
| Latest (July 7, 2026) | 65.2 percent, 98th percentile of the year |
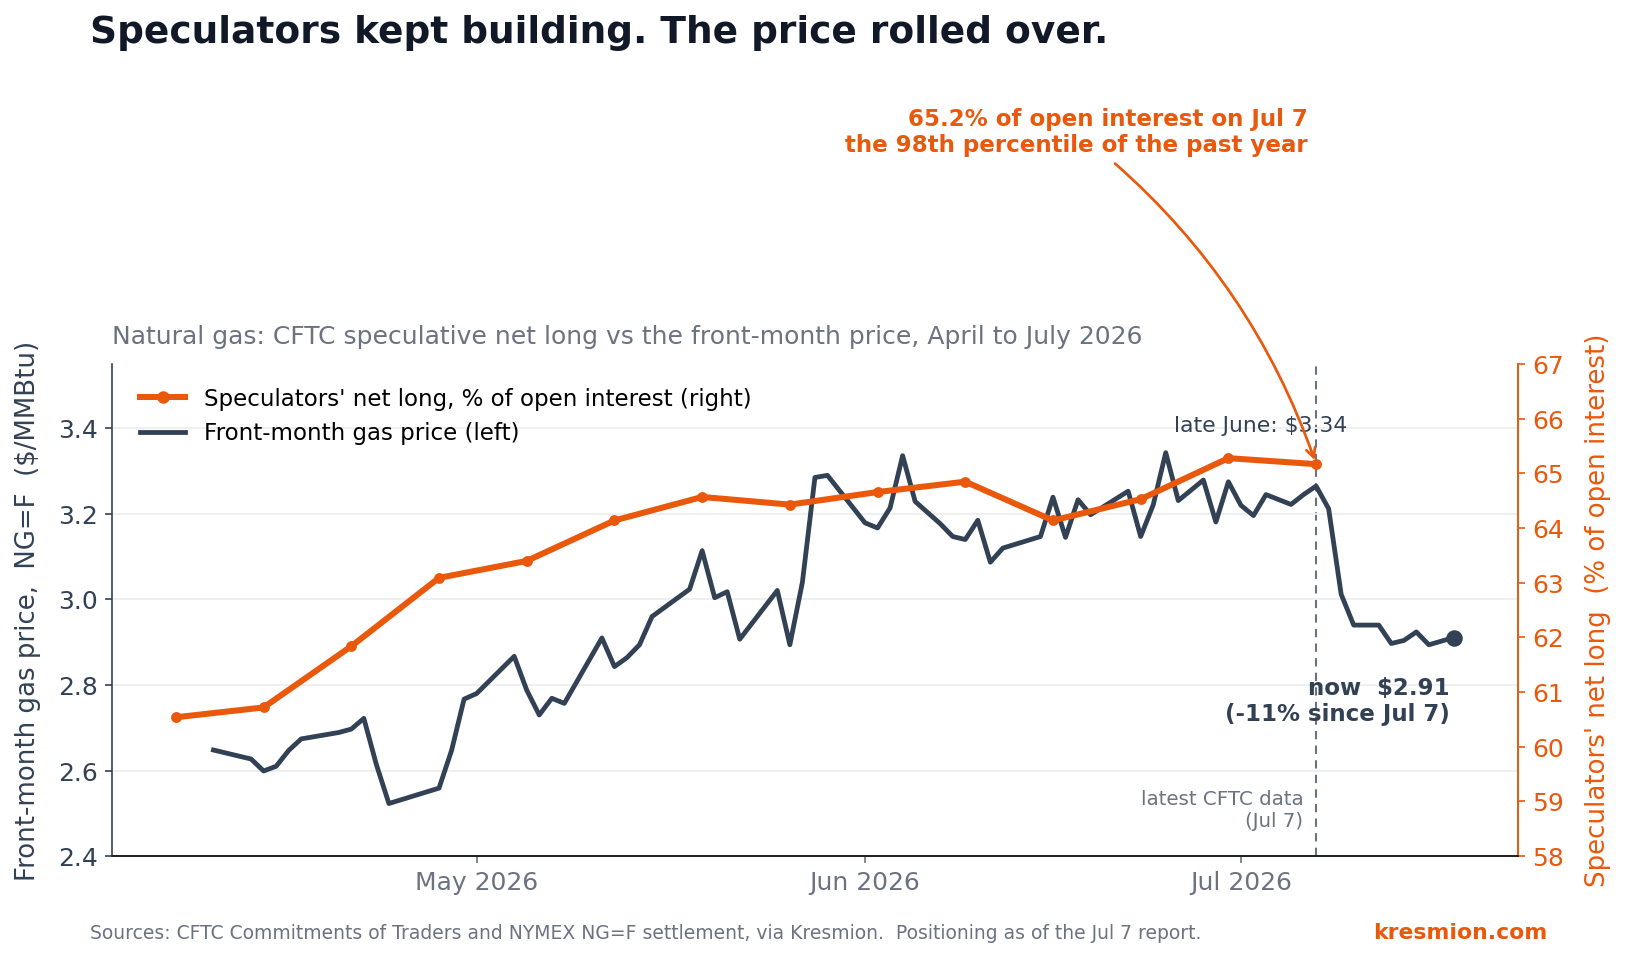
CFTC non-commercial net long as a percent of open interest for natural gas, weekly (left axis), against the front-month NG=F settlement price in dollars per MMBtu (right axis), May 2025 to July 2026. The positioning line climbed steadily to a one-year high while the price stayed in a low range. Sources: CFTC Commitments of Traders via Kresmion cot_reports; NG=F daily settlement via Kresmion futures_prices, verified July 18, 2026.
This is a position that was built slowly and deliberately. A year ago the net long ran near 54 percent of open interest. It climbed through the winter, accelerated through spring, and has held above 64 percent since the start of June. That is not a one-week reaction to a headline. It is a standing view that natural gas is set up to tighten.
The case the longs are leaning on
The case for the longs is not imaginary. Three separate things happened this month that a natural gas trader can point to.
The first is weather. The first heat wave of the summer spread across the central and eastern United States over the July 4 weekend and pushed power demand higher. Natural gas burned for electricity generation averaged about 45.6 billion cubic feet per day in the week ending July 7, more than 15 percent above the prior week, as air conditioning load climbed.
The second is the grid. On July 14 the largest US grid operator, PJM Interconnection, published the results of its capacity auction for the 2028 to 2029 delivery year. For the second auction in a row, the entire region cleared below its reliability requirement, this time by the widest margin yet, procuring 138,318 megawatts and falling 6,831 megawatts short of the target, with the price pinned at the FERC-approved cap of 325 dollars per megawatt-day. The prior auction, released in December 2025, was the first RTO-wide shortfall in the operator's history, at about 6.6 gigawatts short; this one is larger. The Federal Energy Regulatory Commission chair, Laura Swett, said the numbers "compound the alarm bells for a call to action in PJM," and the operator said it would seek approval for a special backstop procurement in September. A grid that cannot secure enough capacity is a grid that leans harder on gas-fired generation to keep the lights on.
The third is exports. US liquefied natural gas terminals continue to pull gas toward the coast for overseas buyers, a demand channel that did not exist at this scale a few years ago and that competes directly with domestic power burn for the same molecules.
Put together, that is a coherent story: hot weather now, a grid short of capacity later, and a growing export straw in the same glass. It is the story the 65 percent net long is built on.
The one number that reconciles it
Against all of that sits the supply side, and it has been winning.
US dry gas production is running at record levels, led by growth out of the Permian basin, where gas comes up as a byproduct of oil drilling regardless of what the gas price does. That associated supply has been large enough to absorb the heat-driven demand surge and keep inventories comfortable. The result is a front-month contract that touched 3.34 dollars at the end of June and has since stepped down to the 2.90 range, with Henry Hub spot briefly printing in the 2.70s in the second week of July. The price has spent the entire period since mid-June inside a narrow band and is now sitting near the bottom of it.
That is the number that reconciles the disagreement. The speculators are pricing scarcity, the grid is warning of scarcity, and the physical market is pricing abundance, because record production keeps swamping every demand signal thrown at it. A crowded speculative long sitting against record supply is an unstable pairing, and the price has already started to move.
The strongest evidence against this read
The case for not treating this week as a warning that gas is set to weaken is substantial, and parts of it cut in the bulls' favor.
The grid signal is real but slow. PJM's shortfall is for the 2028 to 2029 delivery year, not this summer. It says something structural about where US power demand is heading, driven in part by data-center load, but it does nothing to tighten this month's gas balance. An investor leaning on it is leaning on a story that may take years to reach the spot price, and anyone dismissing gas entirely is ignoring a demand channel that is genuinely growing.
The position may already be unwinding. Kresmion's positioning read is as of July 7. The 11 percent price slide happened mostly after that date, which means some of the drop could be speculators cutting the very long position described here rather than fresh selling by others. The next CFTC report, covering the week through July 14, will show how much of the long book came in as the price fell. Until it lands, the current size of the bet is an estimate carried forward from a week ago.
The price is fading, not collapsing. Front-month gas was actually up about 1.85 percent on July 18, and the top of its recent range near 3.34 is not far overhead. This is a market refusing to break higher despite a supportive demand backdrop, which is a weaker statement than a market breaking down.
And the position is partly seasonal. Some of the net long is a routine summer-demand stance rather than deep conviction, and the CFTC report cannot separate a trader hedging a hot-summer tail from one betting the house. Six straight weeks above 64 percent argues for a real standing view, but the ambiguity is honest and worth stating.
What would change the read
Four observable things, in rough order of speed. The next Commitments of Traders report, covering the week through July 14, shows whether the net long held or shrank as the price fell; a sharp drop would mark the position as already unwinding. The front-month price either reclaims the top of its range near 3.34 dollars, which would put the tightening thesis back in play, or keeps printing below 3 dollars through peak summer heat, which would confirm that production is winning. The weekly EIA storage reports either show smaller-than-normal injections, supporting the bulls, or comfortable builds that harden the glut. And PJM's September backstop procurement will show how urgently the grid operator is acting on the capacity shortfall, which speaks to the multi-year demand story rather than this month's price.
Elsewhere on the tape
- The prediction-market crowd spent the week taking Bitcoin crash bets off the table. On Polymarket, the contract on Bitcoin dipping to 55,000 dollars by year-end fell about 9.5 points over seven days to 52.5 percent, and the dip-to-50,000 contract fell 10 points to 33.5 percent, both quoted live from the venue at 10:03 UTC on July 18. Over the same week the odds of reaching 100,000 dollars barely moved, easing 1.5 points to 8.5 percent. The whole distribution compressed toward the current price near 64,000 dollars: fewer crash bets, and no new bets on a breakout.
- One issuer is absorbing nearly all of the Ethereum ETF demand. Kresmion ETF flow data show US spot Ether funds took in about 199.5 million dollars over the past 14 days through July 17, of which BlackRock's ETHA accounted for roughly 189 million, about 95 percent, while US spot Bitcoin ETFs were close to flat on a seven-day basis at minus 1.9 million dollars.
- The cross-asset regime held Neutral for a 23rd straight day, but the nervousness underneath it rose. Kresmion's macro regime score sat near the center of its 90-day range on July 18, yet the volatility factor rolled over hard, with the equity volatility input registering close to one standard deviation elevated, as the AI and semiconductor trade wobbled into the weekend. Rising unease without a regime change.
Key takeaways
| Point | Detail |
|---|---|
| The positioning | CFTC non-commercial traders were net long natural gas by 253,788 contracts, 65.2 percent of open interest, the 98th percentile of the past year, as of July 7 |
| The build | The net long climbed from about 54 percent of open interest a year ago to above 64 percent since early June, a slow and deliberate long position |
| The price | Front-month gas fell from about 3.27 dollars to roughly 2.91 in the 11 days since that report, nearly 11 percent, and sits near the bottom of its recent range |
| The case for it | A July heat wave lifted power burn 15 percent week on week, PJM's grid cleared below its reliability target for a second straight auction by its widest margin yet, and LNG export demand keeps pulling gas to the coast |
| The one number against it | Record US production, led by Permian associated gas, is swamping the demand signals and keeping inventories comfortable |
| The caveats | The grid shortfall is for 2028 to 2029, not this summer; the July 7 position may already be unwinding; the price is fading rather than collapsing |
Frequently asked questions
What does it mean that speculators are net long 65 percent of open interest?
Open interest is the total number of outstanding futures contracts in the market. The CFTC's weekly Commitments of Traders report splits traders into categories, and the non-commercial group is the closest proxy for speculators as opposed to producers and hedgers. When that group's net long position equals 65 percent of all open interest, it means speculative long bets dominate the market to an unusual degree. Kresmion measures the current reading at the 98th percentile of the past 52 weeks, meaning it is near the most heavily net long speculators have been in a year.
Why is the natural gas price falling if demand is strong and the grid is short?
Because supply is stronger still. US dry gas production is at record levels, driven by associated gas from oil drilling in the Permian basin that comes to market regardless of the gas price. That supply has been large enough to meet the heat-driven jump in power-plant demand and still leave inventories comfortable, so the front-month price has drifted lower even with a supportive demand backdrop. The PJM grid shortfall, meanwhile, is a signal about the 2028 to 2029 delivery year, not this month's supply and demand balance.
Does this mean natural gas is about to fall further?
No. This note describes a divergence, not a prediction. A crowded speculative long sitting against a falling price is a fragile setup, but it can resolve in either direction: the price can reclaim the top of its range if production stumbles or storage tightens, or the long position can unwind and add selling pressure. Some of the recent 11 percent drop may already be that unwinding, since the positioning data is as of July 7 and most of the decline came afterward. The next CFTC report will clarify how much of the long book remains.
What is the single most important caveat?
That the positioning number is 11 days old. Kresmion's read on the size of the speculative long is as of July 7, and nearly all of the price decline happened after that date. It is therefore possible that the crowded long described here has already begun to shrink, which would change the setup from a standing bet against a falling price to a position that is actively being cut. The report covering the week through July 14 is the check.
Sources
Kresmion speculative-positioning monitor (cot_reports, market NATURAL GAS): CFTC Commitments of Traders, report week ending July 7, 2026, released July 10, 2026. Non-commercial net long 253,788 contracts against open interest of 389,405, equal to 65.17 percent of open interest; 52-week z-score 1.90; 98.4th percentile of the trailing 62-week series (range 52.0 to 65.3 percent of open interest; the series runs weekly from May 6, 2025 to July 7, 2026). Natural gas is the fourth-largest positioning extreme by absolute z-score among the 13 futures markets Kresmion tracks, after Bitcoin, the S&P 500 E-mini and the euro.
Kresmion futures-price monitor (futures_prices and commodity_prices, symbol NG=F, source yfinance): front-month natural gas settlement 3.265 dollars per MMBtu on July 7, 2026, stepping down through 3.012 (July 9), 2.940 (July 10 and 12), 2.897 (July 13), 2.904 (July 14), 2.924 (July 15) and 2.894 (July 16), to 2.911 as quoted July 18, 2026 at 10:09 UTC, up 1.85 percent on the day and down 0.99 percent on the week; a decline of about 10.8 percent from the July 7 level. Henry Hub daily spot, US EIA series DHHNGSP via FRED: 3.34 dollars on June 30, easing to 2.73 on July 10 and 2.83 on July 13, 2026.
Power-sector demand and production context: power-burn gas demand averaging about 45.6 billion cubic feet per day in the week ending July 7, 2026, more than 15 percent above the prior week during the first summer heat wave, per Rystad Energy estimates reported by Natural Gas Intelligence; US Energy Information Administration Short-Term Energy Outlook attributing contained prices to record production led by Permian-basin growth. https://www.eia.gov/outlooks/steo/report/natgas.php
PJM capacity auction and grid reliability: PJM Interconnection 2028/2029 Base Residual Auction results, released July 14, 2026, clearing 138,318 megawatts at the 325 dollar per megawatt-day cap, 6,831 megawatts below the reliability requirement, the second consecutive RTO-wide shortfall and the largest to date. The prior 2027/2028 auction, released December 2025, was the first such shortfall in PJM history, at about 6.6 gigawatts short. Reserve margin 14.7 percent, with a planned September backstop procurement, and FERC Chair Laura Swett quoted on the results. PJM news release, https://www.pjm.com/-/media/DotCom/about-pjm/newsroom/2026-releases/20260714-pjm-capacity-auction-procures-138318-mw-of-generation-resources.pdf ; Utility Dive, "PJM capacity auction results compound 'alarm bells': FERC Chairman Swett," https://www.utilitydive.com/news/pjm-capacity-auction-governance-ferc-swett/825508/
Kresmion prediction-market monitor (Polymarket, event "What price will Bitcoin hit in 2026?"): live venue quotes July 18, 2026, 10:03 UTC. Dip to 55,000 dollars by December 31, 2026 at 52.5 percent, down about 9.5 points over seven days; dip to 50,000 dollars at 33.5 percent, down 10 points; reach 100,000 dollars at 8.5 percent, down 1.5 points; Bitcoin spot near 63,965 dollars.
Kresmion ETF flow data (crypto_etf_aggregate and crypto_etf_flows): US spot Ether ETF net inflows of about 199.5 million dollars over the 14 days through July 17, 2026, of which BlackRock's ETHA accounted for roughly 189 million; US spot Bitcoin ETF net flow of minus 1.9 million dollars over the trailing seven days through July 17, 2026.
Kresmion macro regime engine (macro_regime, macro_regime_history): cross-asset regime Neutral for a 23rd consecutive day as of July 18, 2026, composite score near the center of its 90-day range, with the volatility factor the dominant drag and the equity-volatility input roughly one standard deviation elevated.
- · Kresmion speculative-positioning monitor (cot_reports, NATURAL GAS): CFTC Commitments of Traders, report week ending July 7, 2026, released July 10. Non-commercial net long 253,788 contracts versus open interest 389,405, equal to 65.17 percent of open interest; 52-week z-score 1.90; 98.4th percentile of the trailing 62-week series (range 52.0 to 65.3 percent of open interest, weekly from May 6, 2025 to July 7, 2026). Natural gas is the fourth-largest positioning extreme by absolute z-score among the 13 futures markets Kresmion tracks, after Bitcoin, the S&P 500 E-mini and the euro.
- · Kresmion futures-price monitor (futures_prices and commodity_prices, NG=F, yfinance): front-month natural gas settlement 3.265 dollars per MMBtu on July 7, 2026, stepping down to 2.911 as quoted July 18, 2026 at 10:09 UTC, up 1.85 percent on the day and down 0.99 percent on the week, a decline of about 10.8 percent from the July 7 level. Henry Hub daily spot, EIA series DHHNGSP via FRED: 3.34 dollars on June 30, easing to 2.73 on July 10 and 2.83 on July 13, 2026.
- · PJM Interconnection 2028/2029 Base Residual Auction results, released July 14, 2026: cleared 138,318 megawatts at the 325 dollar per megawatt-day cap, 6,831 megawatts below the reliability requirement, the second consecutive RTO-wide shortfall and the largest to date; 14.7 percent reserve margin; September backstop procurement planned; FERC Chair Laura Swett quoted. https://www.pjm.com/-/media/DotCom/about-pjm/newsroom/2026-releases/20260714-pjm-capacity-auction-procures-138318-mw-of-generation-resources.pdf ; https://www.utilitydive.com/news/pjm-capacity-auction-governance-ferc-swett/825508/
- · Power-sector demand and production context: power-burn gas demand averaging about 45.6 billion cubic feet per day in the week ending July 7, 2026, more than 15 percent above the prior week during the first summer heat wave (Rystad Energy estimates via Natural Gas Intelligence); US EIA Short-Term Energy Outlook attributing contained prices to record production led by Permian-basin growth. https://www.eia.gov/outlooks/steo/report/natgas.php
- · Kresmion prediction-market monitor (Polymarket, event What price will Bitcoin hit in 2026): live venue quotes July 18, 2026, 10:03 UTC. Dip to 55,000 dollars by year-end at 52.5 percent, down about 9.5 points over seven days; dip to 50,000 dollars at 33.5 percent, down 10 points; reach 100,000 dollars at 8.5 percent, down 1.5 points; Bitcoin spot near 63,965 dollars.
- · Kresmion ETF flow data (crypto_etf_aggregate and crypto_etf_flows): US spot Ether ETF net inflows of about 199.5 million dollars over the 14 days through July 17, 2026, of which BlackRock ETHA accounted for roughly 189 million; US spot Bitcoin ETF net flow of minus 1.9 million dollars over the trailing seven days. Kresmion macro regime engine: cross-asset regime Neutral for a 23rd consecutive day as of July 18, 2026.
Get the smart money brief
The same insider, 13F, and positioning reads you just read, in your inbox when there is something in the data, or live on Telegram. Free, no account.
No fixed schedule: it goes out when the data has something in it. Unsubscribe anytime.
Kresmion publishes information, not investment advice. See our methodology and the latest financial news.