GUIDE
Getting started with Kresmion
A hands-on tour of the platform, from your first five minutes to the API. Everything here works today with a free account, and most reference pages work with no account at all.
On this page
Kresmion is a cross-asset market-intelligence terminal. It pulls together what is happening across equities, crypto, macro, and prediction markets, and it shows you the primary evidence behind every number. It reads public and primary sources: SEC EDGAR filings, CFTC positioning reports, the Federal Reserve's FRED database, on-chain transactions, and public prediction markets. It reports what happened and gives you the structural and historical context. It does not give buy or sell advice.
Kresmion is in free beta. Everything in this guide works today with a free account, and most of the reference pages work with no account at all. Because it is beta, some numbers can lag their upstream source or be revised, and there is no uptime guarantee yet. When a figure matters, check the "as of" timestamp that sits next to it.
This guide walks you from your first five minutes to power-user territory. Read it top to bottom the first time, then keep the cheat sheet in Section 2 nearby.
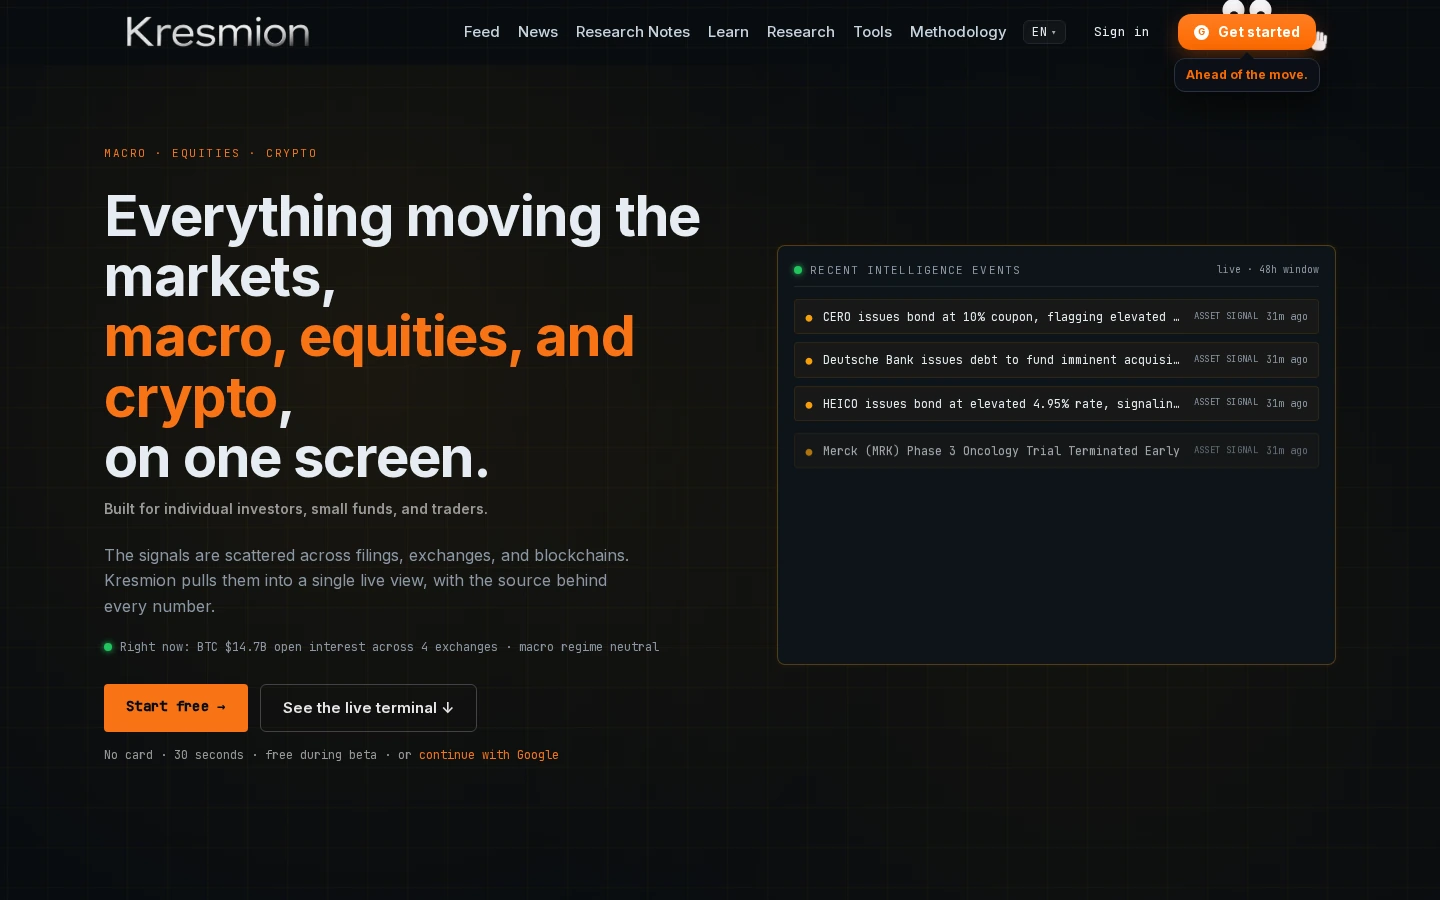
1. Your first five minutes
Sign up from the landing page. You can create an account with an email address or with "Sign in with Google." There is nothing to pay and no card to enter.
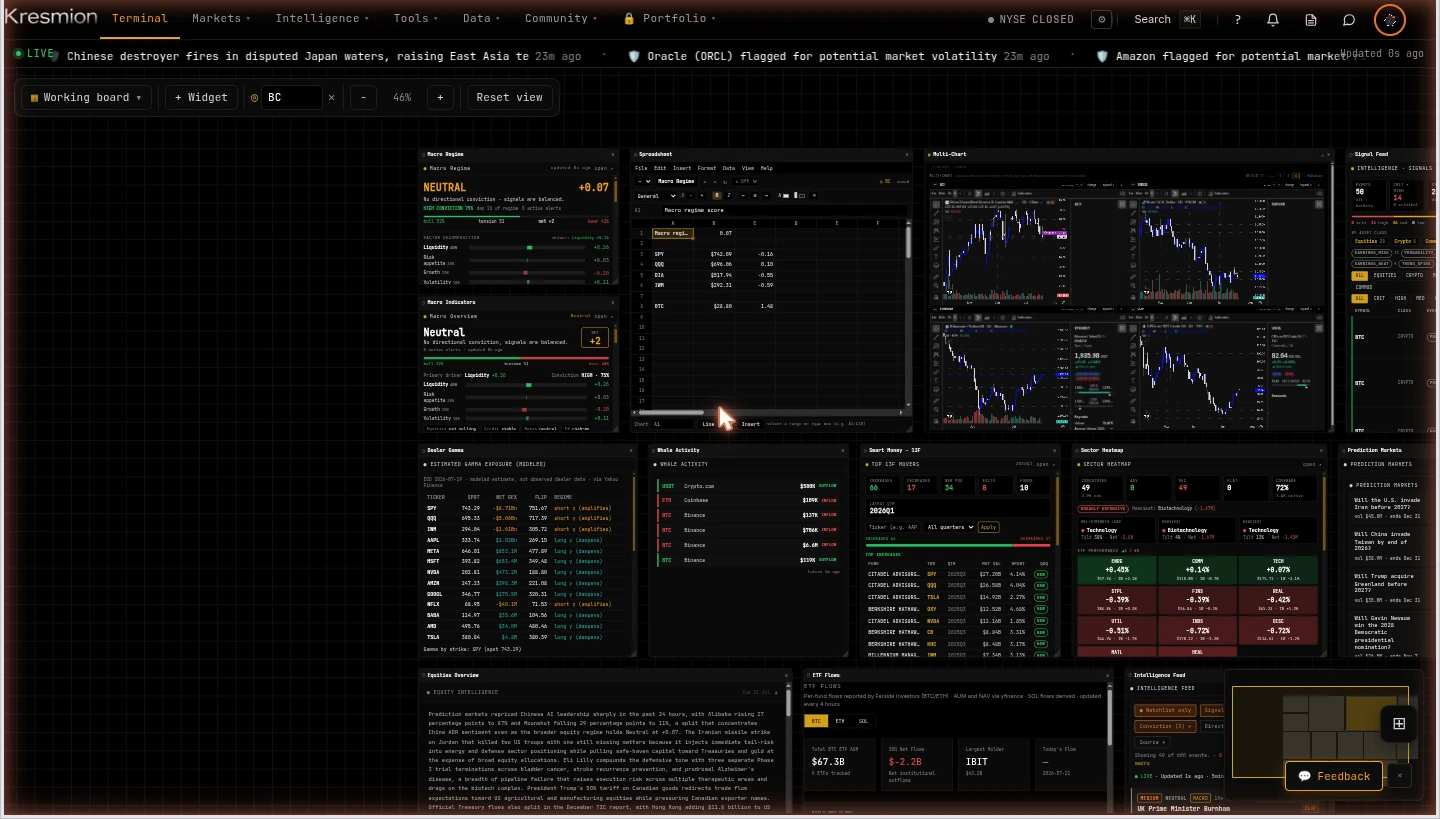
The moment you land, you are dropped onto a board called the Command Center. This is the Terminal, and the Command Center is the default board every new user starts on. It is a dense, single-screen dashboard of live panels. Do not worry about reading all of it at once. Here is what each panel is, grouped the way the board lays them out.
The top band is the pulse of the market right now:
- Macro Regime and Macro Indicators show the cross-asset backdrop, a single score for whether conditions are leaning risk-on or risk-off, plus the underlying indicators that feed it. Section 4 explains the score in plain words.
- Spreadsheet is a live sheet already wired to Kresmion data. It is a real, editable spreadsheet, not a screenshot.
- Multi-Chart is a price chart panel you can point at any asset.
- Signal Feed is the running list of scored events across every market.
The middle band is the harder-to-find data, the part of the platform you cannot easily get elsewhere:
- Dealer Gamma shows options positioning (explained in Section 4).
- Whale Activity shows large on-chain crypto transfers.
- Smart Money 13F shows what institutional funds have been buying and selling.
- Sector Heatmap shows which equity sectors are moving.
- Prediction Markets shows live odds from public betting venues.
The bottom band is broader context: an Equities Overview of market breadth, ETF Flows into and out of crypto funds, and an Intelligence Feed of longer-form events.
The board auto-frames itself on load so everything fits your screen. Scroll or drag to move around it. In the next section you will make it your own.
2. The Terminal
The Terminal is an infinite, zoomable canvas. Think of it as a desk the size of your imagination, with panels you arrange however you like.
Move and resize. Drag a panel by its title bar to move it. Drag its edge to resize it. Pan the whole canvas by dragging the empty background, and zoom with your scroll wheel or trackpad. A minimap in the corner helps you find your way around a large board.
Add anything as a panel. Two kinds of panel exist. Built-in widgets are compact live modules (a chart, a signal feed, the regime status, and so on). But you can also drop any page on the site onto the canvas as a panel. If a page exists in the navigation, it can live on your board as an embedded, live view. That means you can build one board that holds your gamma monitor, your watchlist, a specific company page, and a chart, all visible at once.
Save named boards. Arrange a layout, name it, and save it. You can keep several boards (for example, one for mornings and one for a specific theme you are tracking) and switch between them from the board switcher. The Command Center template is always available to reload if you want to start fresh. If you are not signed in, your working board is still kept locally in your browser so you do not lose it.
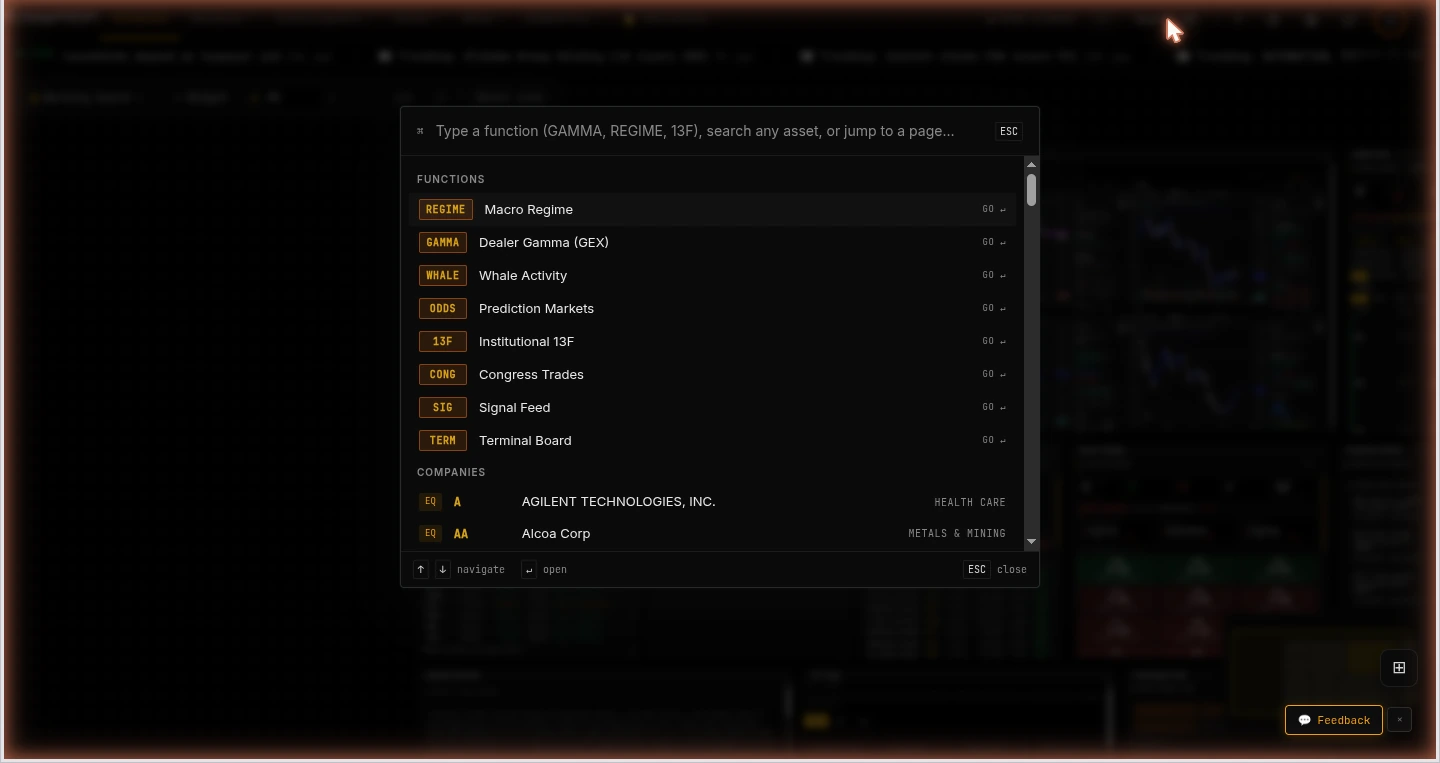
The command bar. Press Cmd+K (or Ctrl+K on Windows and Linux) anywhere to open the command bar. This is the fastest way to move around Kresmion. It does three things at once:
- Search any asset. Type a ticker, a coin, an index, or a currency pair. Equities open a full company page; everything else opens a chart.
- Jump to any page. Type what you want ("congress," "etf flows," "calendar") and it finds the page, even if the page's name does not contain that word.
- Run a function. Kresmion borrows the Bloomberg idea of short mnemonic codes. Type a code like
GAMMA,REGIME, or13F, press Enter, and you land on that monitor. The codes rank first in the results, so a code plus Enter is a one-motion shortcut once you learn them.
You do not have to memorize anything. Open the command bar with an empty box and it shows the most popular functions to get you started. But the codes are worth learning, because they turn navigation into muscle memory.
Mnemonic cheat sheet
Every code below is live. Open the command bar, type the code, press Enter.
| Code | Opens | What you see there |
|---|---|---|
REGIME | Macro Regime | The cross-asset risk-on / risk-off score and its drivers |
GAMMA | Dealer Gamma (GEX) | Modeled options gamma exposure, walls, and the flip level |
WHALE | Whale Activity | Large on-chain crypto transfers with exchange labels |
ODDS | Prediction Markets | Live public-market odds on events (Fed, elections, crypto) |
13F | Institutional 13F | What hedge funds and institutions filed as holdings |
CONG | Congress Trades | US congress members' disclosed stock trades |
INSDR | Insider Trades | Corporate insider buying and selling from Form 4 |
ETF | Crypto ETF Flows | Daily net flows into and out of spot crypto ETFs |
ECO | Economic Calendar | Upcoming releases (CPI, jobs, FOMC) with actuals |
SIG | Signal Feed | The unified scored feed of events across all markets |
SCR | Screener | Filter equities and other assets by your own criteria |
CHART | Multi-Chart | A multi-pane price chart for comparing assets |
TERM | Terminal Board | Back to your canvas workspace |
EQ | Equities Overview | Market breadth across the equity universe |
CMDTY | Commodities | Oil, gold, copper, natural gas, and other commodities |
PM | Prediction Markets (Intel) | The deeper prediction toolkit: calibration, divergence |
BRIEF | Daily Brief | The operator-reviewed daily research note |
LEARN | Learn | Evergreen explainers and studies |
3. Signals and alerts
A signal is a scored event: a cluster of insider buying, a sharp move in a prediction market, a whale transfer, a new institutional position, and so on. Every signal Kresmion detects flows into one feed. You can read that feed as a page (the SIG function, or "All Markets" under Intelligence), as a panel on your board, or on the public Smart Money Feed at /feed.
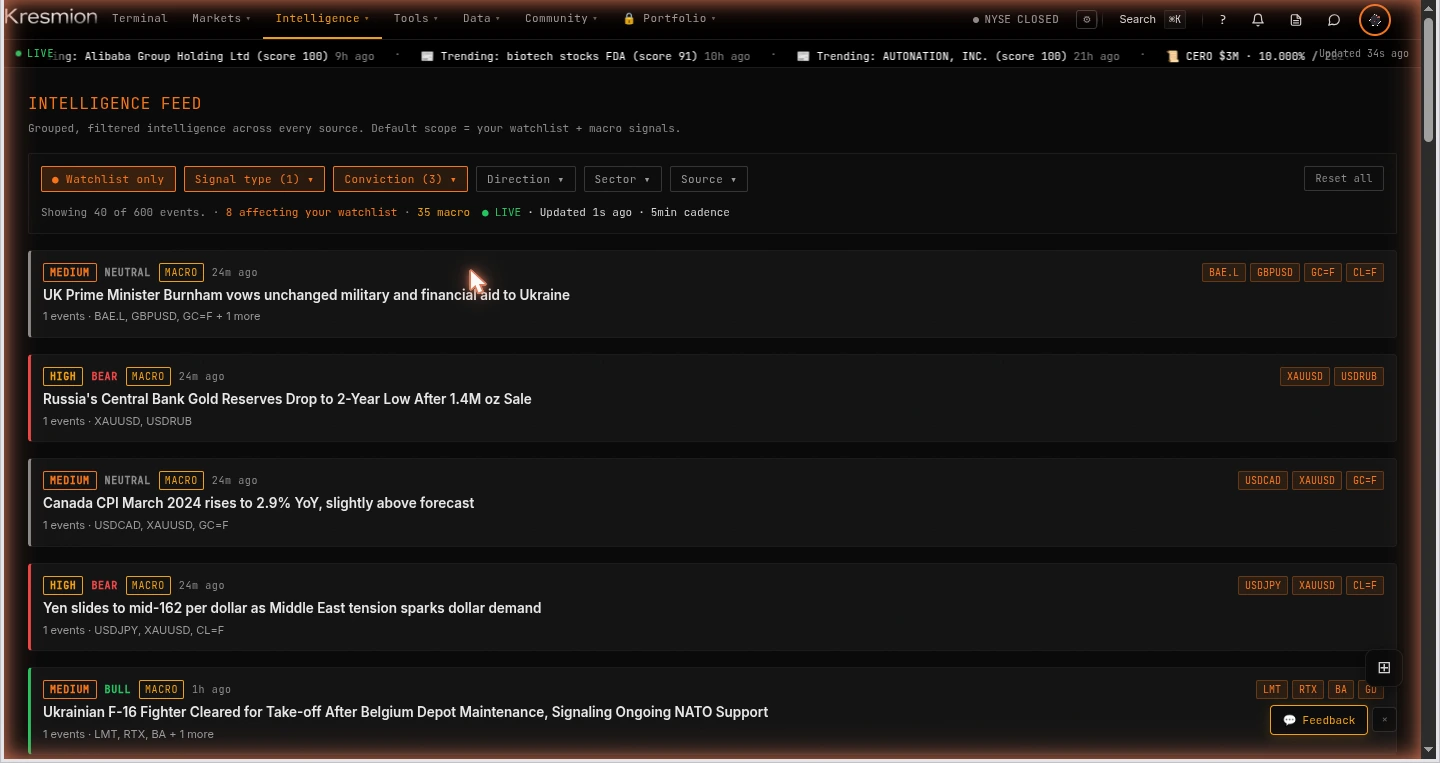
Severity. Each signal carries one of four severity levels: low, medium, high, or critical. Severity reflects how strong and how unusual the event is, based on the numbers behind it. It is a description of the event's size, not a recommendation.
The one gotcha that trips up new users: alert delivery is watchlist-gated. There is an important difference between a signal appearing in the feed and a signal being pushed to you as an alert. Every signal shows up in the feed. But Kresmion will only actively deliver an alert to you (in the app and over Telegram) when two things are true: the signal is strong enough to clear a minimum strength bar, and the asset is on your watchlist. If your watchlist is empty, almost every alert is held back, and Kresmion sends you a one-time nudge to go build one.
So the first practical thing to do after signing up is build your watchlist. Add the tickers and assets you actually care about. From then on, the events that matter to you get pushed to you instead of sitting in a feed you have to remember to check. A handful of broad, structural signal types (for example, extreme net positioning across a whole market) bypass the watchlist gate on purpose, because they are market-wide rather than about one name.
Where alerts go. Delivered alerts arrive in two places: in-app notifications, and the Kresmion Telegram broadcast if you connect it. You control what reaches you from the alerts settings page. Alert emails are muted by default during beta; in-app and Telegram are the live channels.
4. The monitors, by asset class
This is the heart of Kresmion. Each monitor below answers a different question. For each one: what it shows, where the data comes from, and when you would open it.
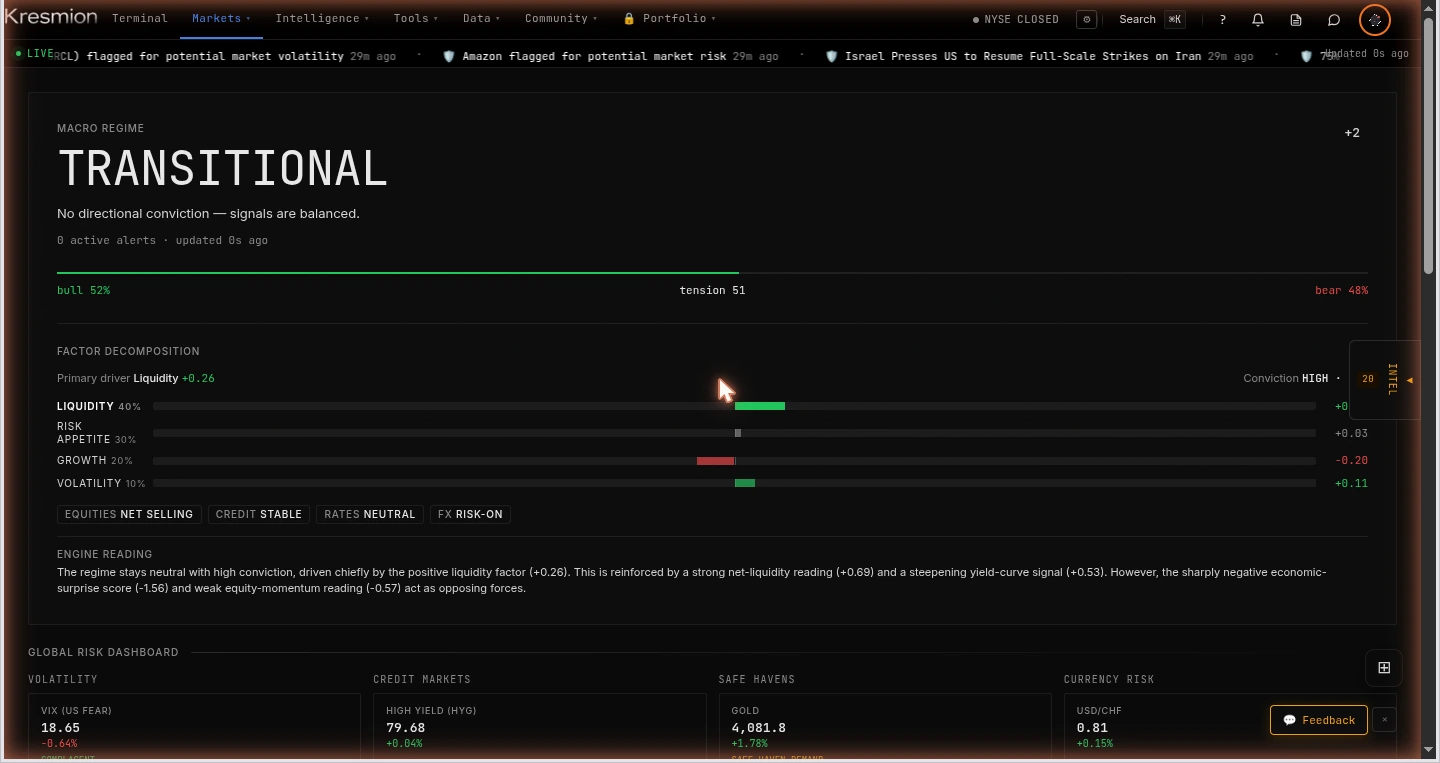
Macro regime. This is the cross-asset backdrop condensed into one number on a scale from -3 to +3. In plain words: a strongly positive score means conditions across growth, liquidity, risk appetite, and volatility are leaning risk-on together, while a strongly negative score means they are leaning risk-off together, and a score near zero is neutral. The bands are labeled for you: above +1.5 is Strong Risk-On, +0.5 to +1.5 is Risk-On, -0.5 to +0.5 is Neutral, -1.5 to -0.5 is Risk-Off, and below -1.5 is Strong Risk-Off. The score blends yield-curve shape, real yields, the dollar, credit spreads, equity momentum, and volatility gauges, drawn from FRED and public market data, then smooths the result. Open it (the REGIME function) when you want a one-glance read of the overall weather before you look at any single asset.
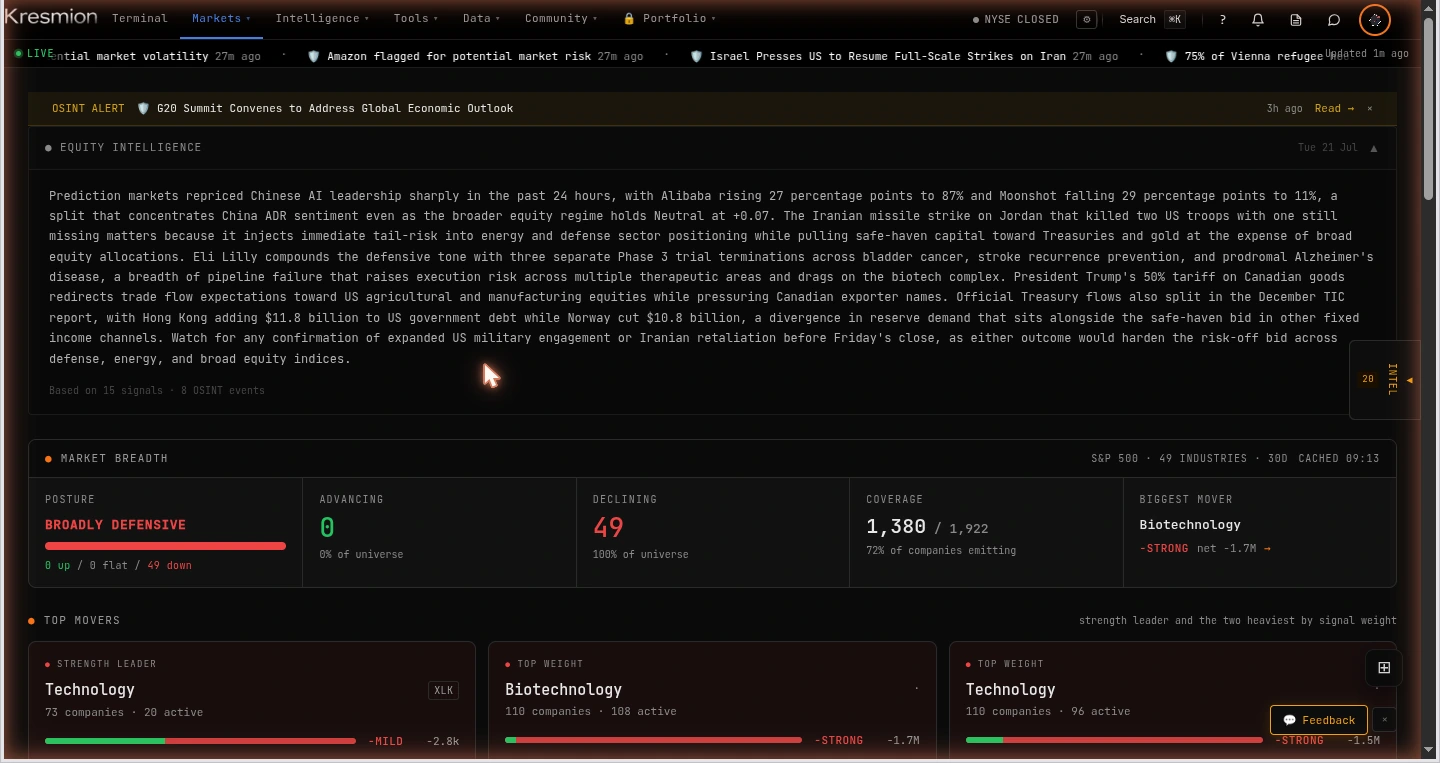
Equities and breadth. The Equities Overview is a breadth command center: it shows how broad a market move is, sector by sector, rather than just where the index closed. Open it (the EQ function) when the headline index number hides what is happening underneath it.
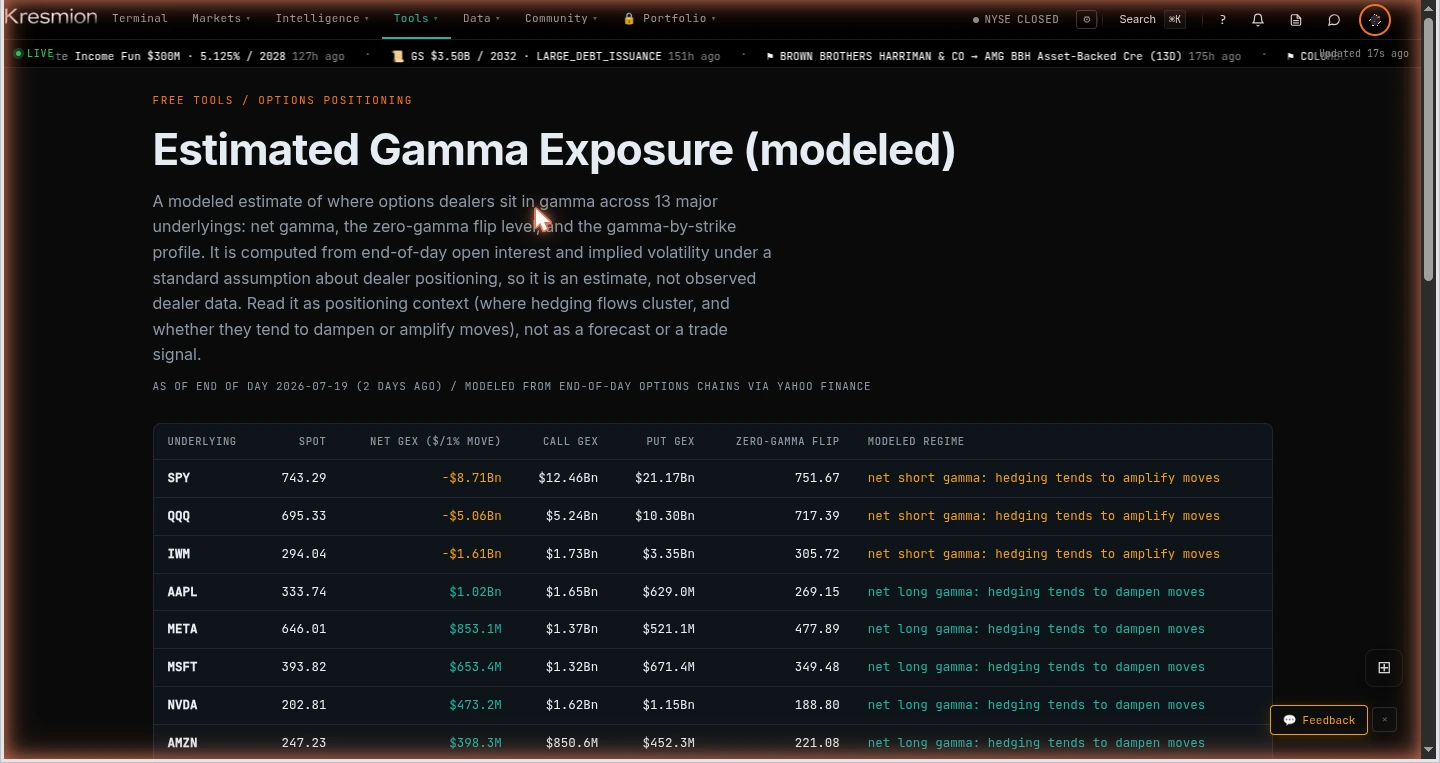
Dealer gamma. "Gamma exposure," or GEX, is a model of how options dealers are positioned. When you buy an option, a dealer is usually on the other side, and to stay balanced the dealer buys or sells the underlying stock as the price moves. Kresmion models the net of that positioning per stock, shows the strike levels where it concentrates ("walls"), and marks the "flip" level, the price at which dealer hedging behavior tends to change character. The data is modeled from public options open interest. Open it (the GAMMA function) when you want to understand the mechanical pressure around a stock's price rather than the fundamentals.
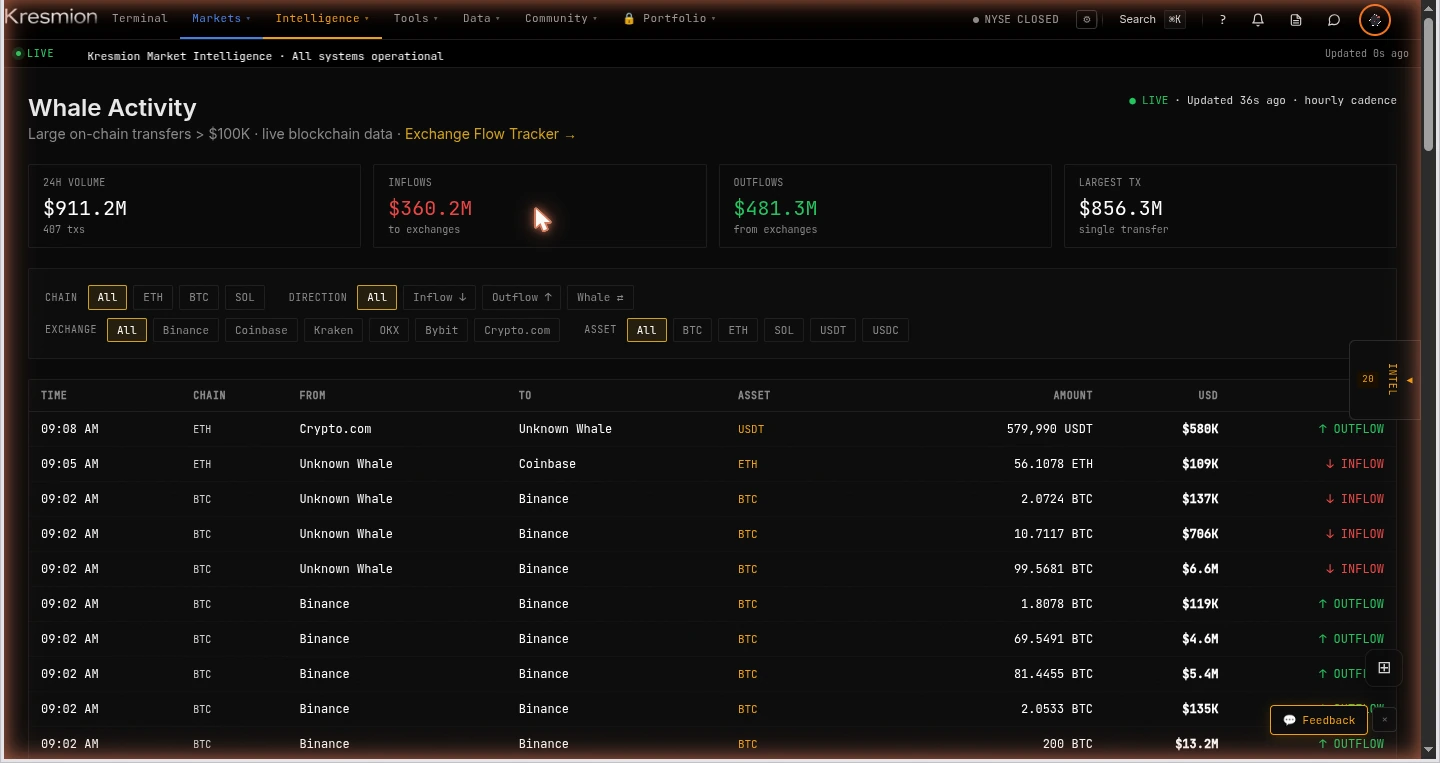
On-chain whales. This tracks large cryptocurrency transfers on the Bitcoin, Ethereum, and Solana blockchains, labeling the exchange wallets involved so you can see when size is moving toward or away from an exchange. The data is read straight from the chains and from public block explorers, with transfers between an exchange's own wallets filtered out. Open it (the WHALE function) when a coin is moving and you want to see whether large holders are repositioning.
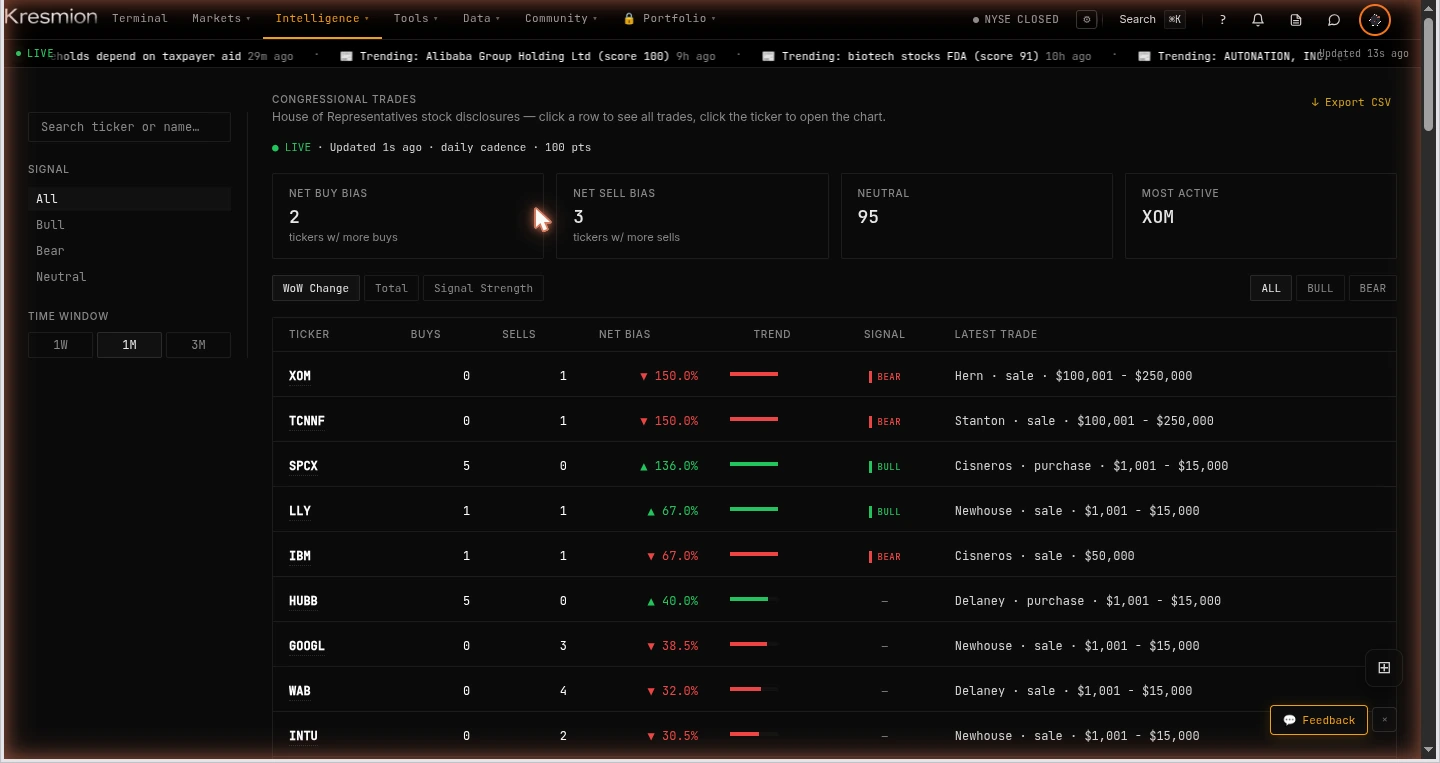
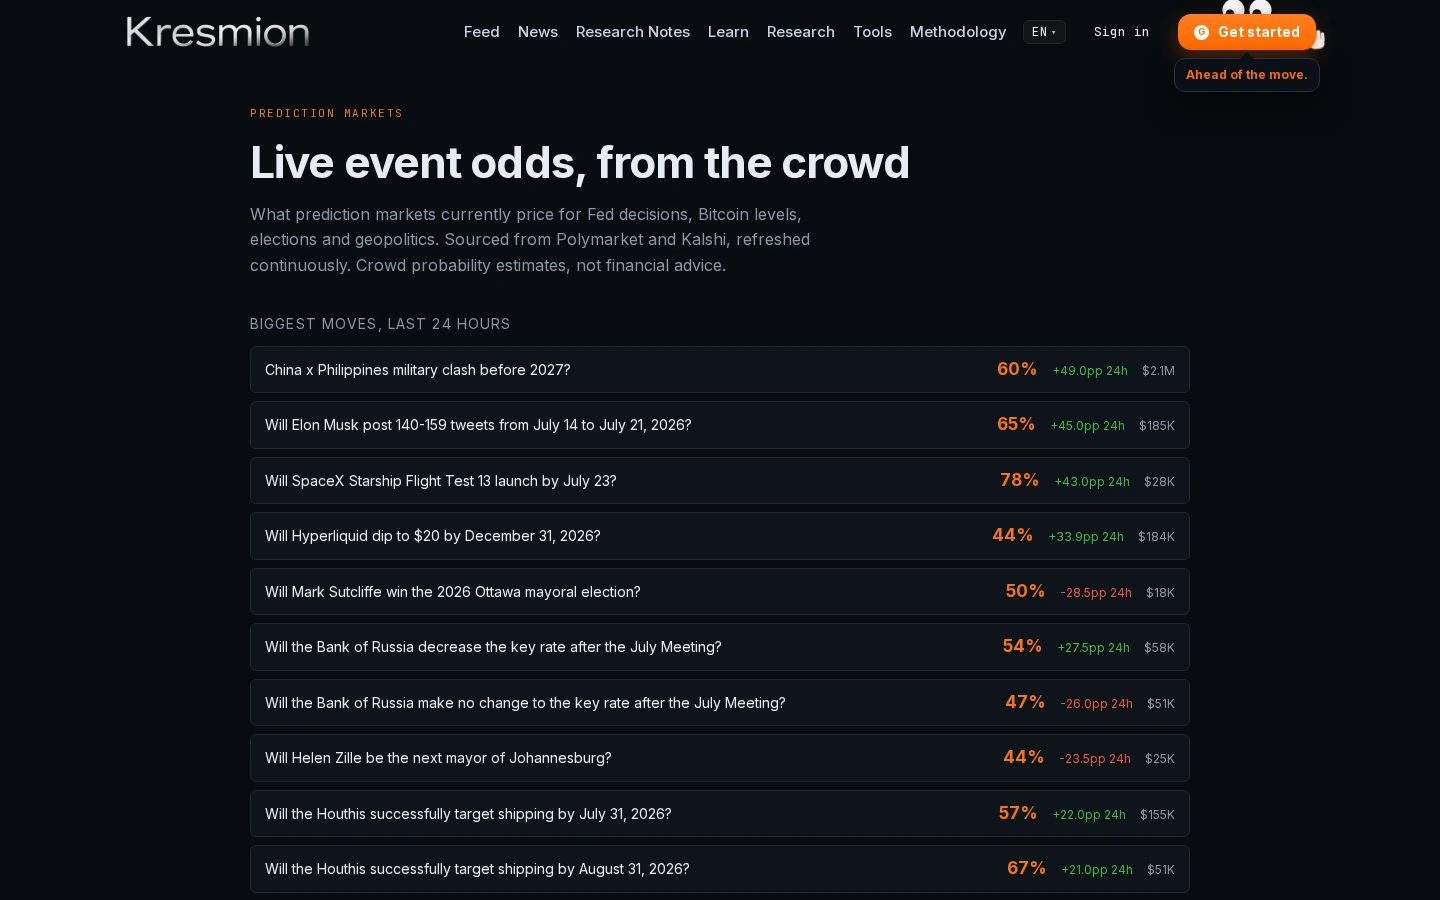
Prediction markets. These are live odds from public betting venues (Polymarket and Kalshi) on real-world events: interest-rate decisions, elections, crypto price levels, and more. The odds are a crowd's live probability, quoted as a percentage. The ODDS function opens the public index; the PM function opens a deeper toolkit that compares the two venues, tracks how sharply markets move, and scores how well the crowd has been calibrated historically. Open it when you want the market's own probability on an event rather than a pundit's guess.
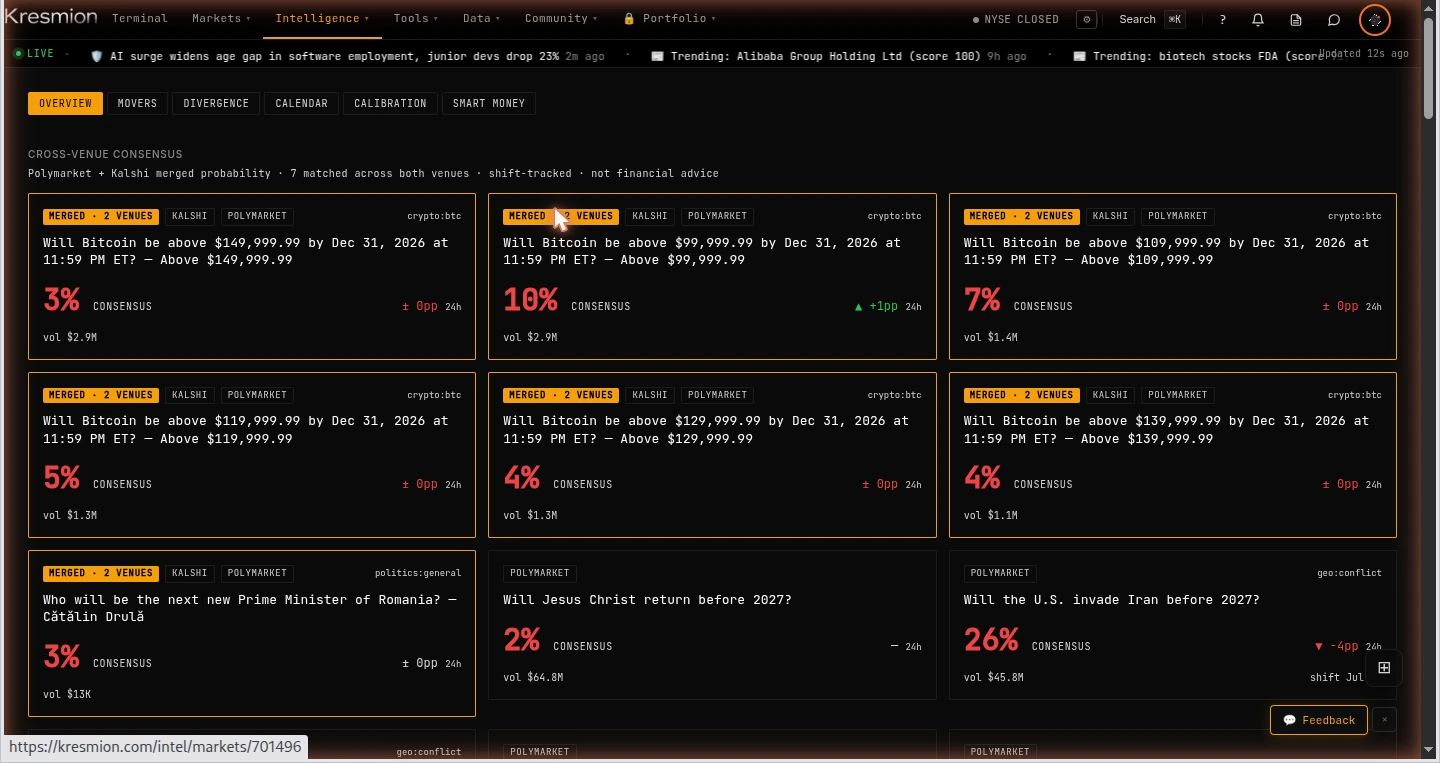
Futures and COT. The Commitments of Traders report, or COT, is a weekly CFTC disclosure of how different groups of futures traders (commercial hedgers, large speculators) are positioned in each contract. Kresmion presents it as a readable positioning view alongside a futures dashboard that covers seasonality and volatility across roughly nineteen contracts. The source is the CFTC itself, backed by price history. Open it when you want to see how positioning in oil, gold, bonds, or currencies has shifted.
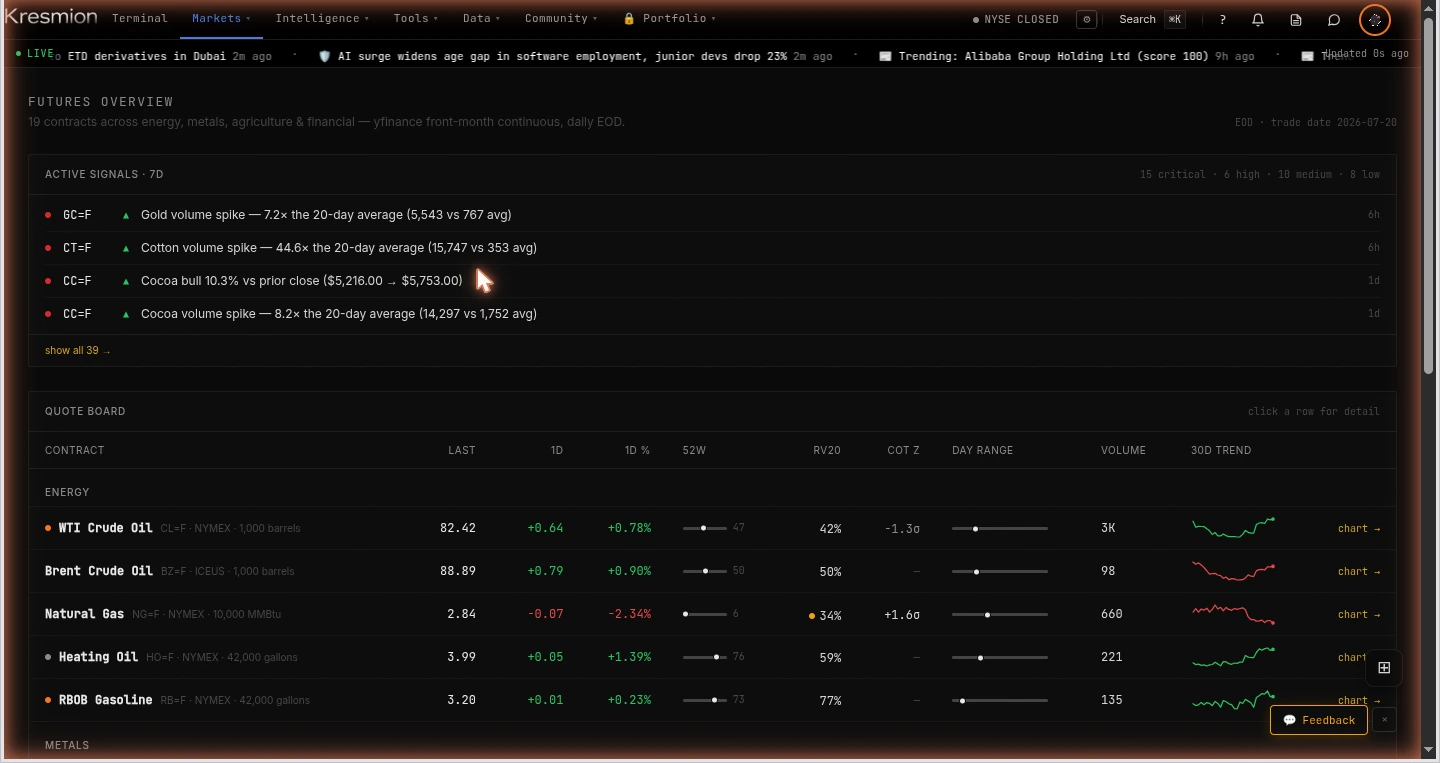
ETF flows. This shows the daily net money moving into and out of spot crypto exchange-traded funds (for Bitcoin, Ethereum, and Solana). A fund's flows are a clean read on whether that vehicle saw net buying or net selling that day. Open it (the ETF function) when you want a demand read that is independent of price.
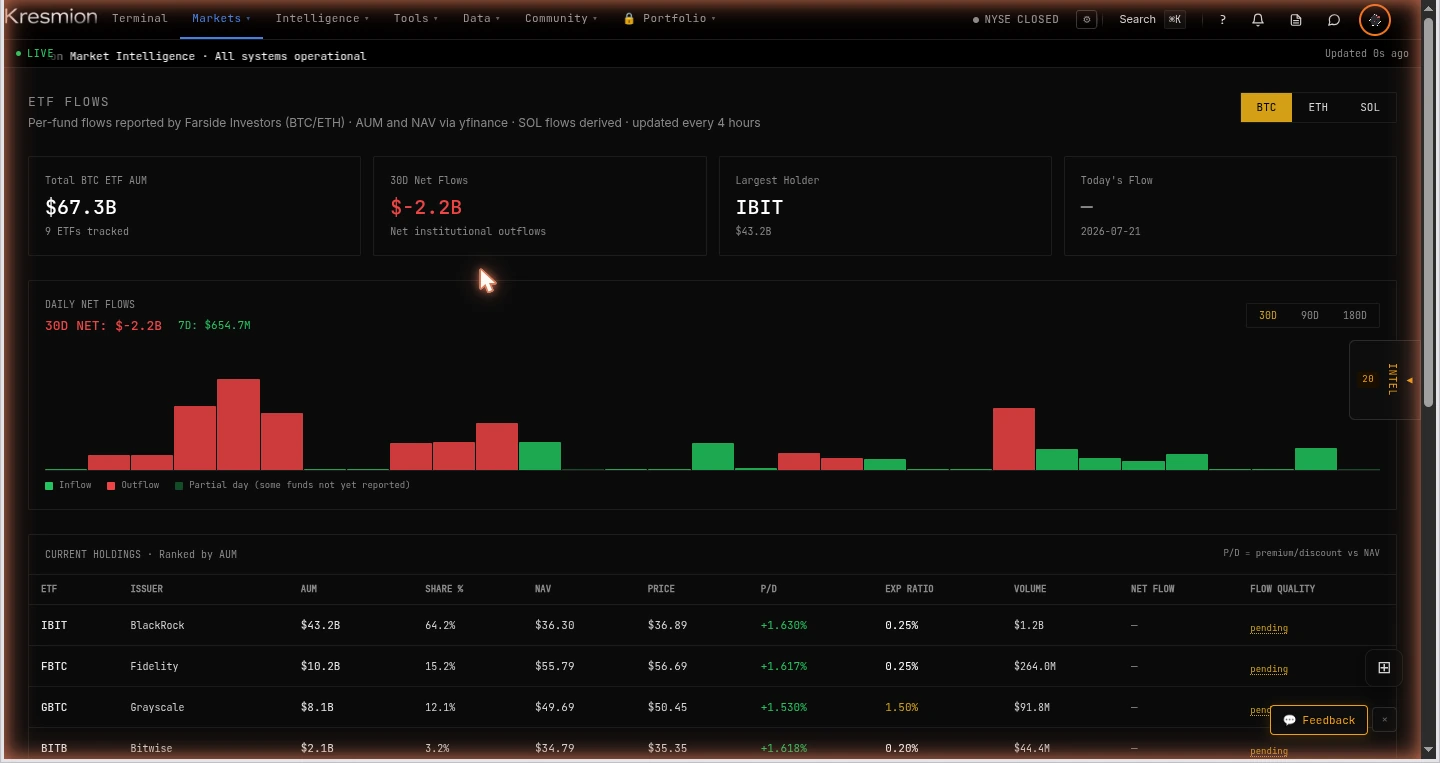
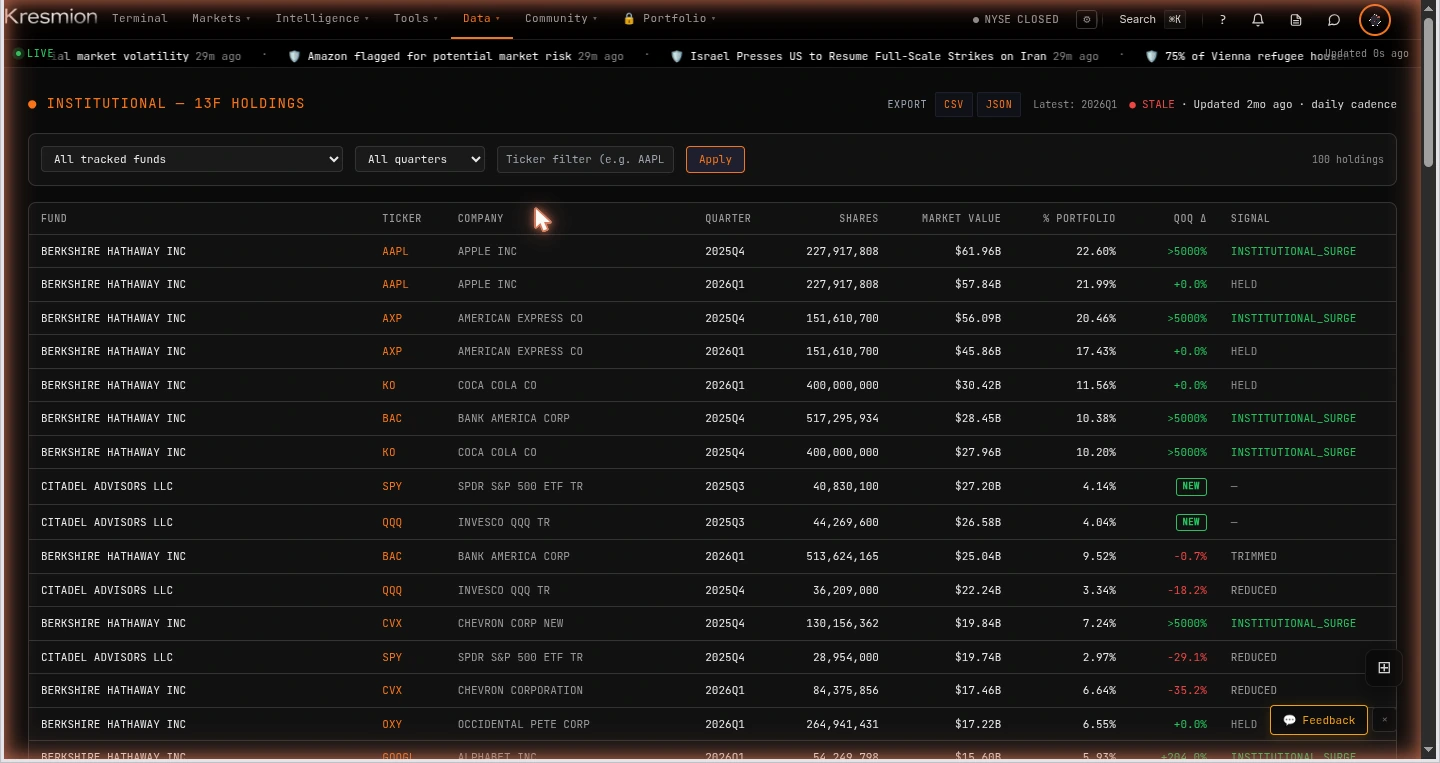
Institutional, congress, and insider positioning. Three related monitors read directly from primary disclosures. 13F (the 13F function) shows quarterly institutional holdings from SEC 13F filings: what funds hold, in what size, and how it changed quarter over quarter. Congress (the CONG function) shows US congress members' stock trades from their STOCK Act disclosures, each linked to the primary filing. Insider trades (the INSDR function) shows corporate insiders buying and selling their own company's stock, from SEC Form 4 filings, and flags clusters where several insiders act in the same direction in a short window. Open these when you want to see what the people closest to a company or a fund are actually doing on the record.
5. Your research workspace
Kresmion is not just monitors to watch. It is a place to keep your own work.
Documents. The Documents area is a full file explorer, reachable from the header. It works like a desktop file manager: a folder tree on the left, the current folder's contents on the right, breadcrumbs, drag-and-drop to file things away, inline rename with F2, and a name filter that searches the whole tree. It holds three kinds of document together: your notes, your evidence boards, and your spreadsheets. Deleting a folder never deletes what is inside it; the contents move up to Home.
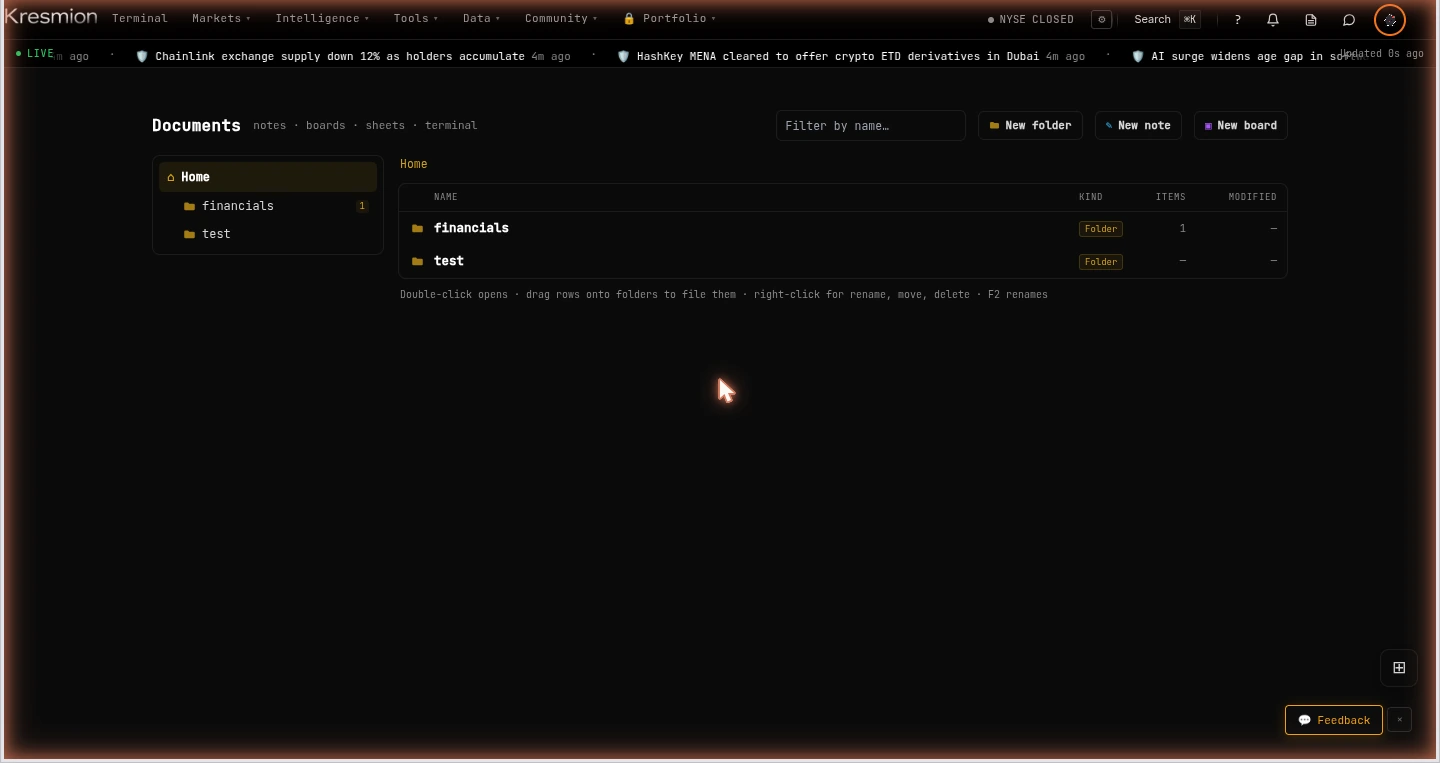
Notes. Notes are block-based documents for writing up a thesis or keeping a log. You can save any note into a folder to keep your research organized.
Live spreadsheets. The spreadsheet is a real, editable sheet with roughly 398 standard functions, plus a set of live Kresmion functions that pull platform data straight into a cell. You write them like any formula. The live functions include:
=PRICE("AAPL")and=CHANGE("AAPL")for price and daily percent change=SMARTMONEY("PFE")for a composite positioning score from -100 to +100=CONFLUENCE("BTC")for a cross-family confluence score=HOLDERS13F("NVDA")for the number of 13F funds holding a name=INSIDER("NVDA")and=CONGRESS("NVDA")for insider and congressional activity=GAMMA("NVDA")for options gamma exposure (add"flip"for the flip price level)=ETFFLOW("BTC")for the latest daily ETF net flow=FUNDING("BTC")for the latest perpetual funding rate (the periodic payment between long and short holders that keeps a perpetual future near spot)=PUTCALL("NVDA")for the put/call open-interest ratio=ODDS("fed cut")for the live probability of a prediction market=REGIME()for the macro regime score=TRACKRECORD("NEW_POSITION","d7")for the median forward return after a signal type=ASOF("smart_money")to check how fresh a data source is
Sheets come with templates to start from, and you can share a sheet with anyone through a link. The =FOCUS() function is a nice touch on the Terminal: it returns the ticker your board is currently focused on, so one sheet re-computes as you switch names.
Evidence boards. An evidence board is a place to pin clips: quotes, numbers, and headlines you want to assemble into a case. Boards live in Documents alongside your notes and sheets.
Highlight anything to save it. This is the glue that ties the workspace together. Highlight any text anywhere on the dashboard and a small toolbar appears with three actions: Note, Board, and Copy. Choose Note or Board and a file-manager pops up so you can drop the clip into an existing note or board, or make a new one on the spot. It means you can read a monitor, find something worth keeping, and file it without leaving the page.
6. Entity pages: the company dossier
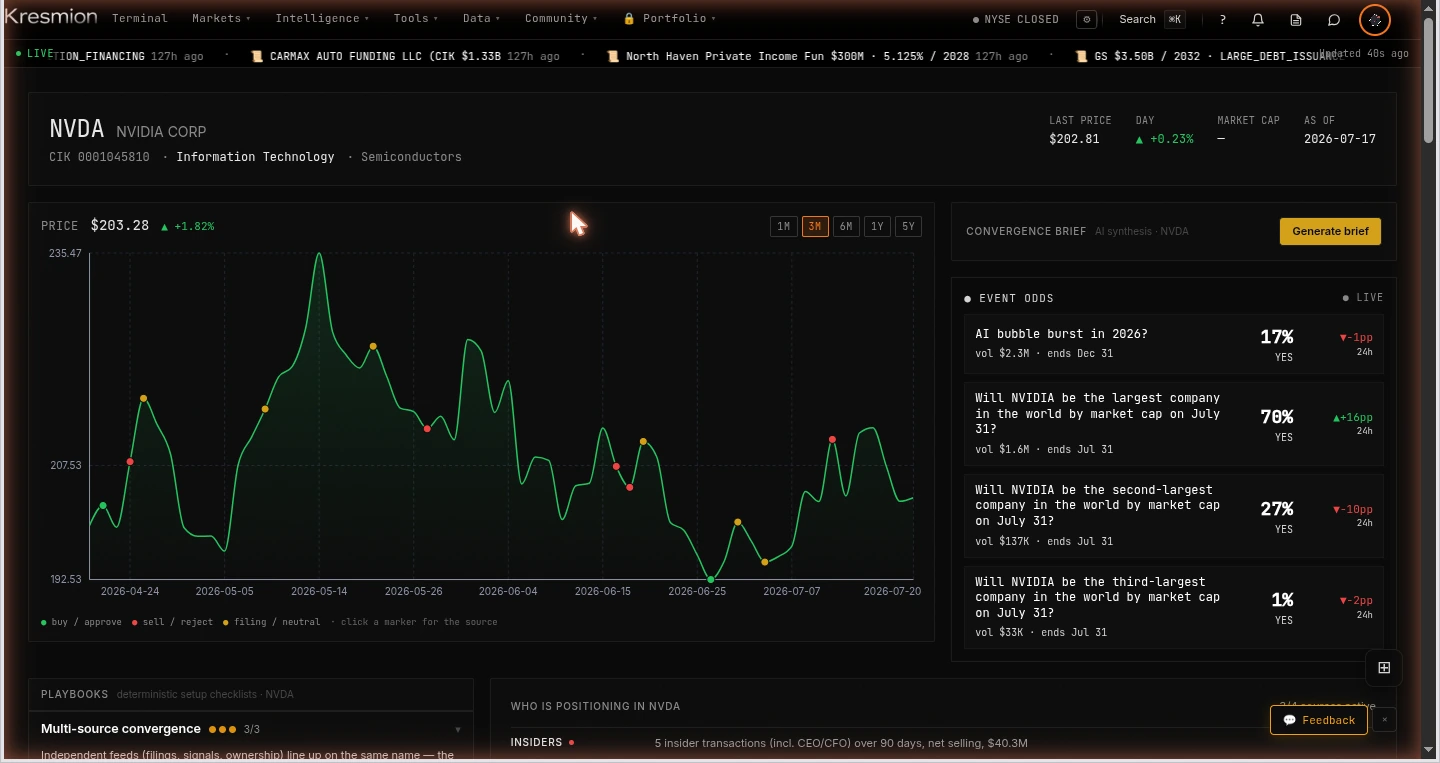
Search any equity ticker in the command bar and you land on that company's dossier at /companies/[ticker]. This is the single richest page on Kresmion, and it is worth a walkthrough. From top to bottom:
- Header. The company's identity with its current price, day change, and market capitalization.
- Price chart as the anchor, with a Convergence Brief beside it. The Convergence Brief is a written synthesis of what the various signals on this name are saying together. Under it, Event Odds shows any prediction market that maps to the company (it hides itself when none applies).
- Playbooks and the Positioning Dossier. The dossier answers "who is positioning" in four rows: Insiders, Congress, Institutions (13F), and Activists (13D/G). It is the disclosure trail for the name in one panel.
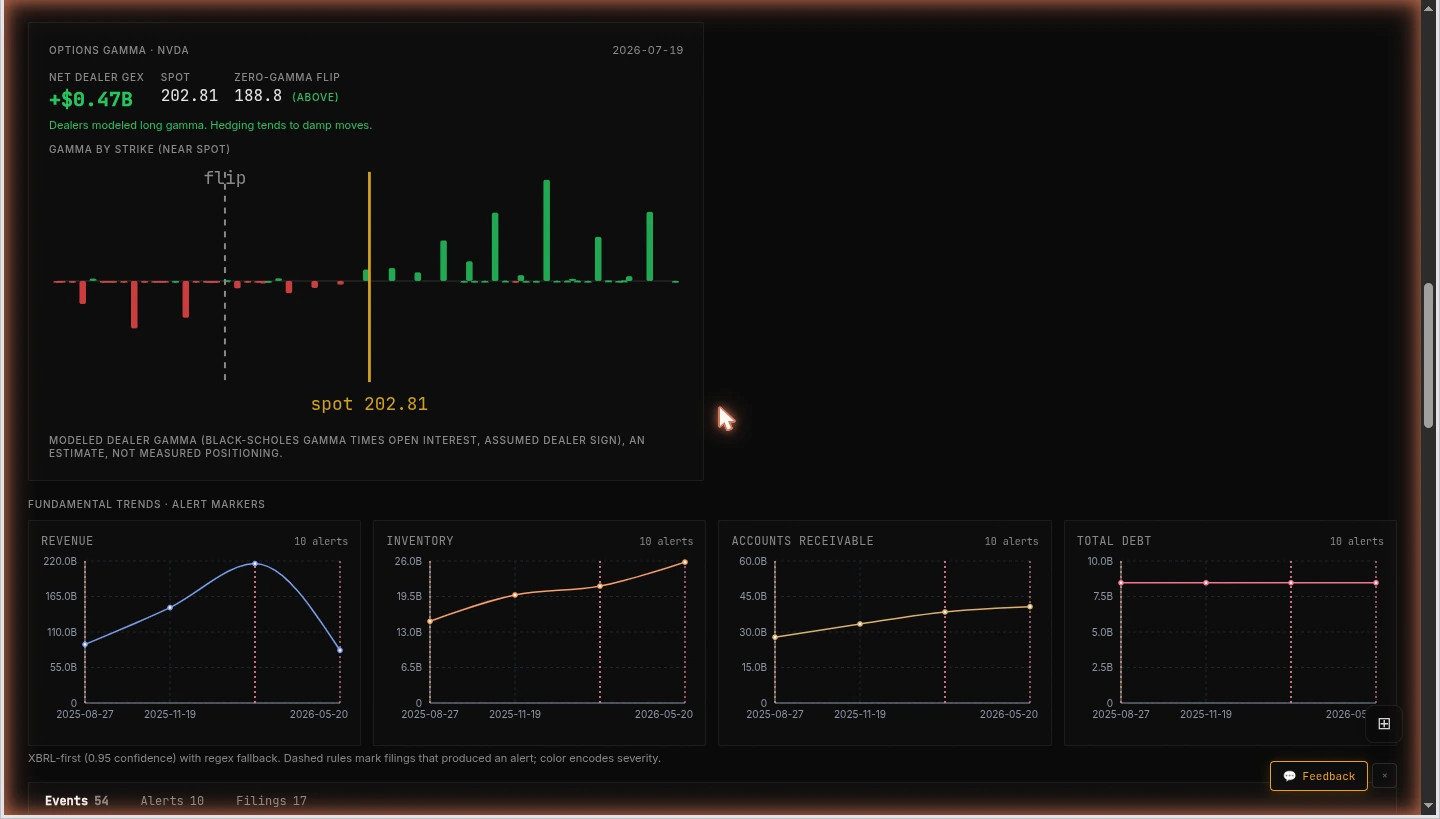
- Gamma dossier. For names with liquid options, this shows the net dealer gamma, the gamma by strike near the current price, the flip level, and the spot price. It hides itself on names without a tracked options market, so most tickers will not show a gap.
- Fundamental trends. A compact strip of sparklines for revenue, inventory, accounts receivable, and total debt, drawn from the company's own filings (read from structured XBRL data where available, with a fallback parser otherwise). Dashed lines mark filings that produced an alert, colored by severity.
- Filings, alerts, and events, tabbed into one panel so you can page through the paper trail.
- Peers and community at the bottom: comparable companies, and any discussion other Kresmion members have had on the name.
7. For power users
Everything you see on Kresmion is available as data you can pull into your own code, sheets, and agents.
Self-serve API keys. Any free account can mint an API key from Settings. Keys start with krm_. They are read-only credentials: a key can read data but cannot write, delete, or move anything. You can hold up to five keys, revoke any of them at any time, and lock a key to specific IP addresses. The free tier allows 10,000 calls per month at up to 120 requests per minute; going over the rate returns a standard "429, wait and retry" response. If you need more, contact the team for a higher tier.
The HTTP API. The base URL is https://kresmion.com/api/v1. You authenticate by sending your key as a Bearer token. Every response uses the same envelope, with a data payload and an "as of" freshness stamp, so you always know how current a number is. The endpoints cover prediction markets, crypto (whales, exchange holdings, ETF flows, derivatives), equities (signals, insiders, congress, 13F), macro (the regime score, COT, Treasury flows, BIS indicators), the unified signal feed, and an intelligence set (the published signal track record, confluence composites, and a delta feed for efficient polling). There is also a bulk export path for pulling whole datasets as compressed CSV, and webhooks that push signed callbacks when events fire, so you do not have to poll.
The docs. The full, live reference is at /developers, rendered directly from the OpenAPI spec at https://kresmion.com/api/v1/openapi.json. It lists every endpoint with its parameters and responses.
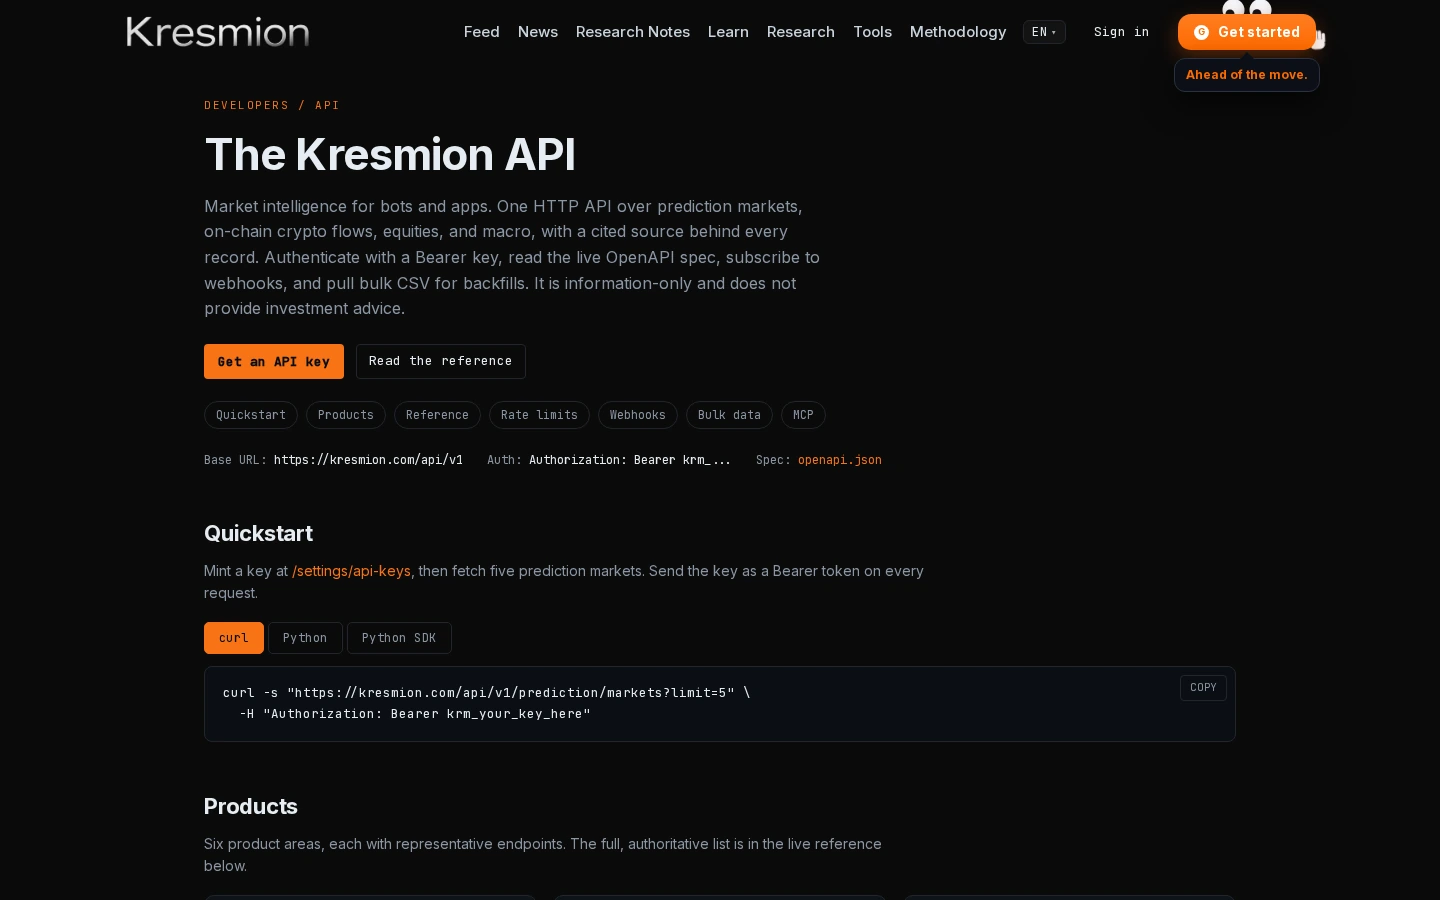
The Python SDK. Install it with pip install kresmion. It wraps the same API in a typed client.
The MCP server. For AI agents, Kresmion runs a Model Context Protocol server at https://kresmion.com/api/mcp that exposes 27 tools covering the same data. In Claude Code it is a one-line add:
claude mcp add --transport http kresmion https://kresmion.com/api/mcp --header "Authorization: Bearer krm_your_key"
There is also a standalone local server if you prefer to run it yourself. The same key, quota, and rate limits apply.
The Excel add-in. Kresmion ships an Excel add-in so the same live functions you use in the on-site sheet work in your own workbook.
All of it is free during beta, information-only, and not investment advice.
8. Free tools, no account needed
You do not need to sign up to get value from Kresmion. A large public surface is open to anyone, and it is a good way to see the data before you create an account.
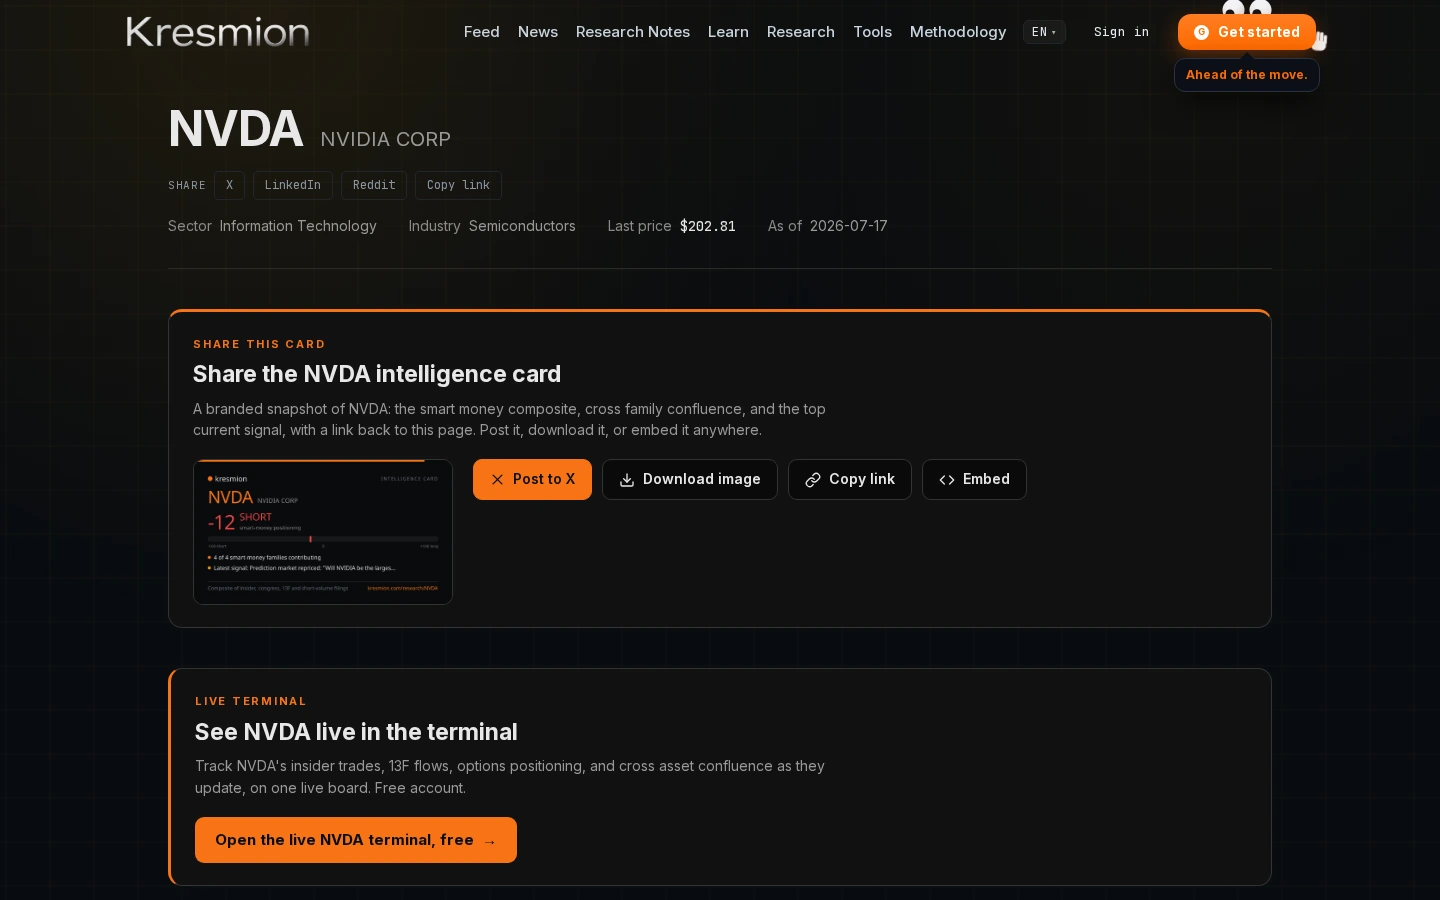
- Research pages. Visit
/research/[ticker]for any company (for example,/research/NVDA) to get a public snapshot of its signals, positioning, and holders. - The Smart Money Feed at
/feedis a live public stream of four kinds of event: congress trades, insider clusters, whale transfers, and 13F fund moves, each linked to its primary source. - Prediction odds at
/oddsshow today's public-market probabilities on Fed decisions, elections, Bitcoin levels, and more. - The daily brief at
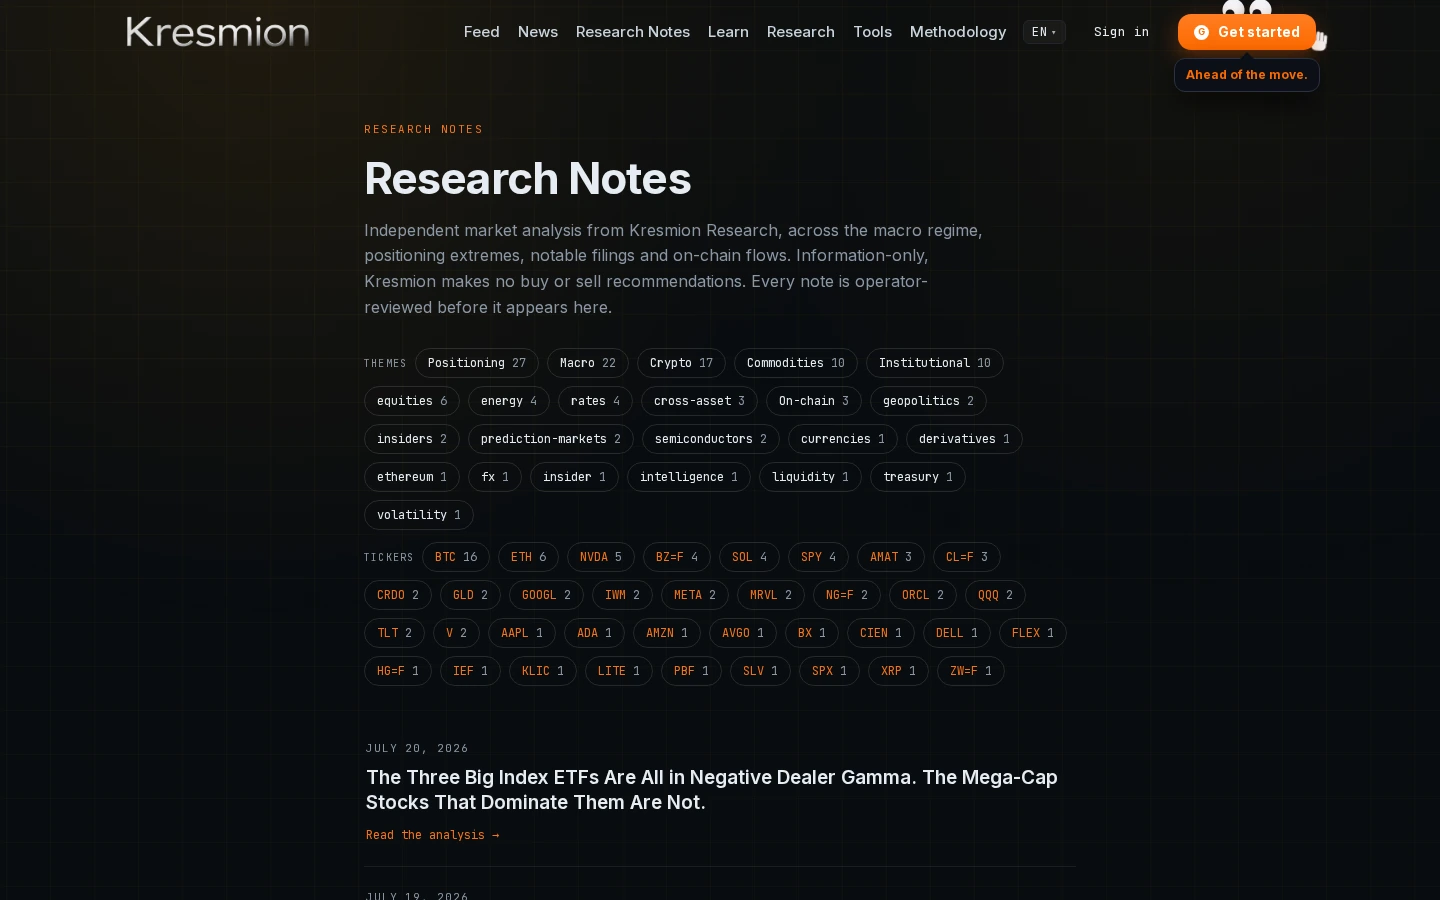
/daily-briefis Kresmion's operator-reviewed daily research note. - Learn at
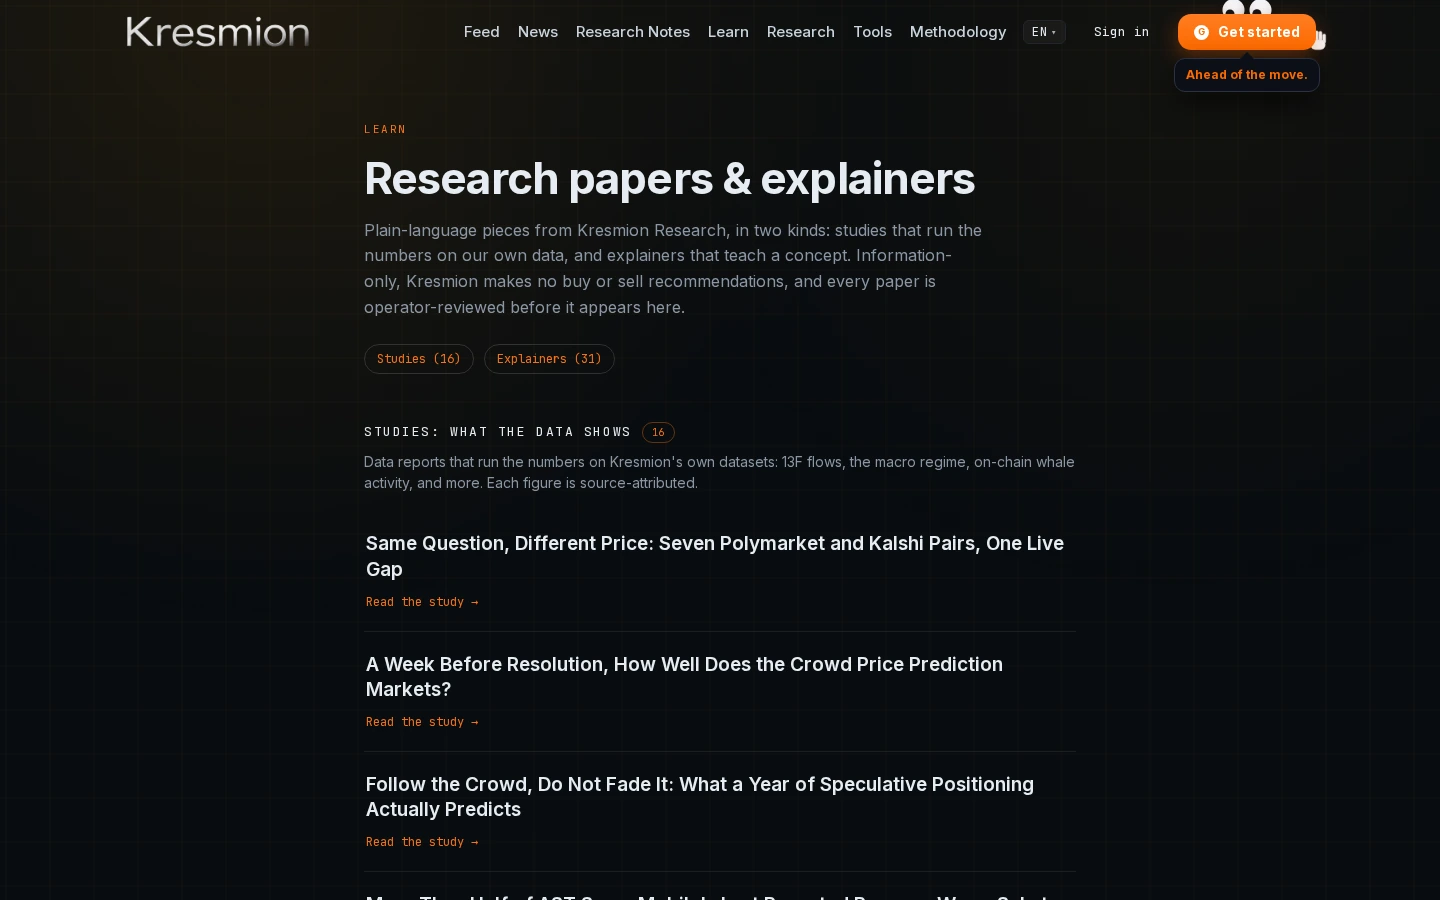
/learnis a library of evergreen explainers and studies for the concepts behind the platform. - The tools pages under
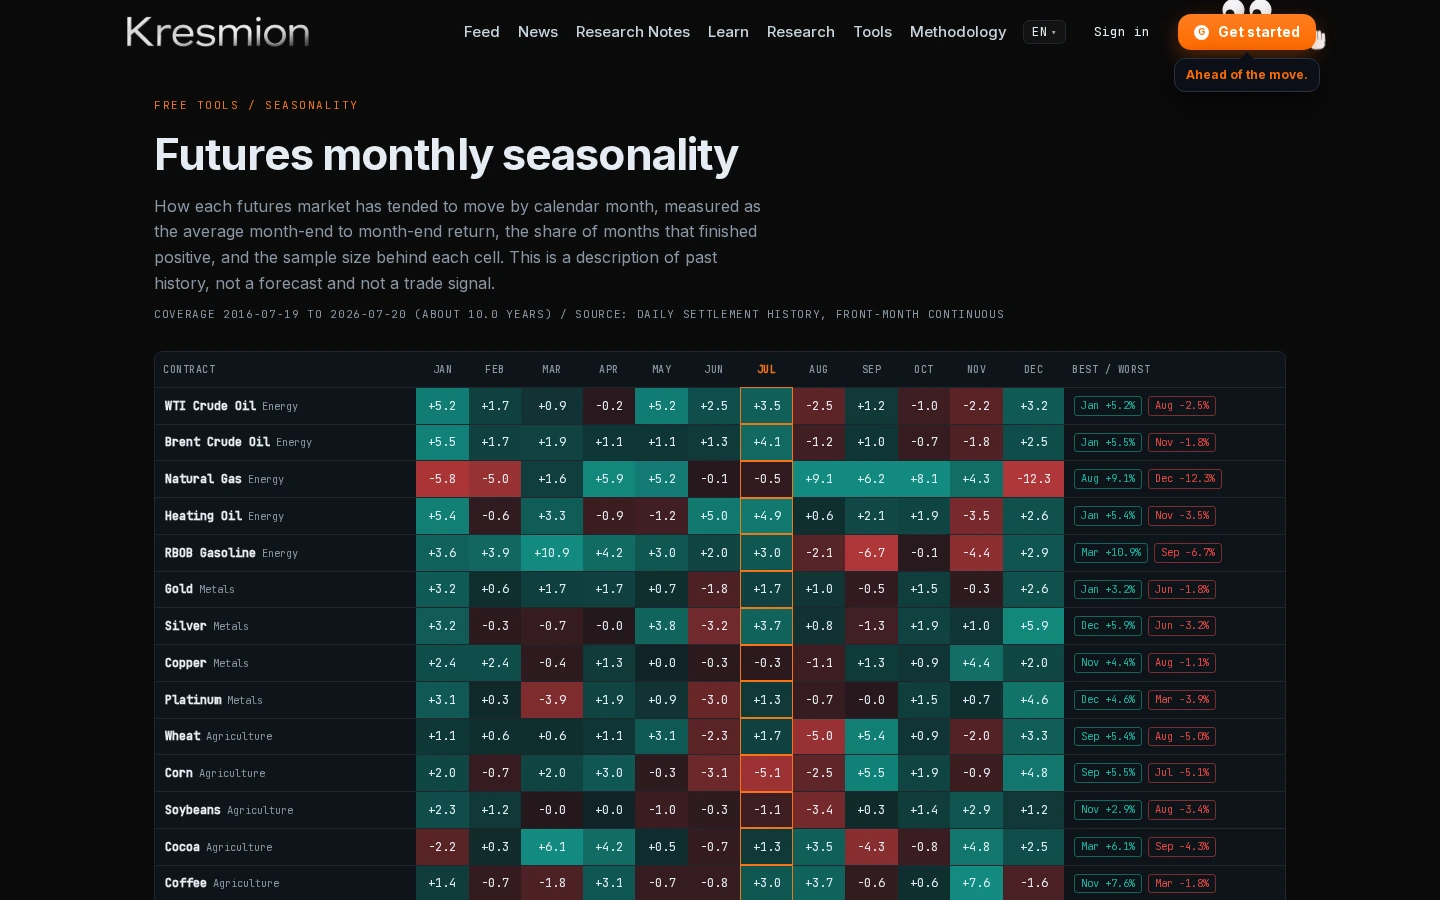
/toolsare single-purpose public data products. Verified public ones include the COT positioning tool, gamma exposure, primary-dealer positions, short volume, insider clusters, congressional anomalies, correlation regime, sector rotation, yield curve, options-implied probability, futures seasonality, futures volatility, the futures curve, the prediction-market screener, and a position calculator.
Kresmion is built on the idea that the primary evidence should be one click away, and that a tool should tell you what happened without telling you what to do about it. Start with the Command Center, build your watchlist so the right alerts reach you, learn a handful of mnemonic codes, and make one board your own. That is the whole loop.
Kresmion publishes event framing and verified data, not investment advice. Create a free account to build a watchlist and turn on alerts.