
Study · Kresmion Research
Did the Stocks Hedge Funds Bought Most in Q1 Beat the Market?
Across 832 stocks that at least five tracked funds held long at the close of the first quarter of 2026, the equal-weight forward return was 6.49 percent over the nine weeks after the filings became public.
On a plain equal-weight basis the convergence basket returned 6.49 percent and slightly lagged SPY at 8.11 percent, but it led the broad market on breadth and edged ahead on a dollar weighting, so the answer depends entirely on how you count.
What "the stocks hedge funds bought most" actually means
Every quarter, large institutional managers file a Form 13F that lists their long U.S. equity positions as of the quarter-end date. We track a set of those filers. For the first quarter of 2026, with a snapshot date of March 31, we asked a simple question: which stocks did the largest number of the funds we follow hold at the same time? When five or more distinct funds independently report a long position in the same ticker, we call that a convergence name. It is a buyer-popularity screen, not a conviction vote and not unanimity. A stock can be a convergence name because five funds each hold a small slice of it.
The screen produced 841 tickers where at least five distinct funds held a long position, with options excluded so only true share holdings count. Of those, 832 have a computable price return over our forward window, because nine names have no matching company record and a handful more lack a price snapshot inside the window. That 832-name set is the universe this study measures.
The forward window
We then asked what those stocks did next. The 13F is filed with a lag of up to 45 days after quarter-end, so the earliest a member of the public sees the full picture is mid-April. We therefore measured a forward window that a real reader could have acted on: the first closing price on or after April 13, 2026, to the last closing price on or before June 15, 2026. That is roughly nine weeks. All returns here are price-only. They exclude dividends, financing costs, transaction costs, and any adjustment for risk or beta.
What the convergence basket returned
The headline numbers for the full 832-name set:
- Equal-weight mean forward return: 6.49 percent.
- Median forward return: 2.04 percent.
- Hit rate, the share of names that rose: 58.1 percent, or 483 of 832.
- Market-value-weighted mean: 8.46 percent.
The gap between the 6.49 percent equal-weight mean and the 2.04 percent median tells you the average is being pulled up by a small number of large winners. The single best name was EVC at plus 195.4 percent, held by five funds, and the single worst was FULC at minus 54.6 percent, also held by five funds. Both sat at the five-fund floor and both are small caps. When you weight every name equally, those extreme small-cap swings count as much as the largest holdings, which inflates the noise in the equal-weight average without reflecting where the dollars actually were.
The market-value-weighted mean of 8.46 percent fixes that. It weights each stock by the total dollar position the tracked funds held in it, so a giant holding counts more than a micro-cap that five funds dabbled in. On that conviction-true basis the basket returned 8.46 percent.
Did it beat the market?
The cleanest broad-tape benchmark over the exact same window is SPY, which carries a full daily closing series in our snapshots table. SPY rose from 686.10 on April 13 to 741.75 on June 12, a forward return of 8.11 percent. Against that single number, the verdict splits three ways.
On naive equal weighting, marginally no
The equal-weight basket returned 6.49 percent against SPY at 8.11 percent. On the simplest possible reading, where every convergence name counts the same, the group lagged the index by about 1.6 percentage points. The drag came from the long tail of small and micro-cap names at the five-fund floor, which swung widely in both directions and, on balance, did not keep pace.
On a dollar or cap weighting, marginally yes
The market-value-weighted basket returned 8.46 percent against SPY at 8.11 percent, an edge of about 0.35 percentage points. When you let the dollars vote, the convergence set nosed ahead of the tape. The largest, most widely held positions did the work.
On breadth, clearly yes
Here the convergence screen separated itself most. The hit rate, the share of names that simply went up, was 58.1 percent for the convergence set. For the broad priced universe, every one of the 7,701 companies that had a closing price on both ends of the window, the share that rose was 49.1 percent, with a median return of 0.00 percent and an equal-weight mean of 14.24 percent. That mean is inflated by micro-caps, so for the broad universe the fair central reads are the hit rate and the median, not the average. The fair breadth comparison is therefore convergence at 58.1 percent positive against the broad universe at 49.1 percent positive. Being a stock that several tracked funds agreed on was associated with positive outcomes about nine percentage points more often than the broad market.
So "did they beat the market" has no single answer. On the typical-stock and dollar-weighted reads, the convergence set was roughly in line with or slightly ahead of SPY. On the odds of any given name rising, it was clearly ahead.
Where the edge actually lived
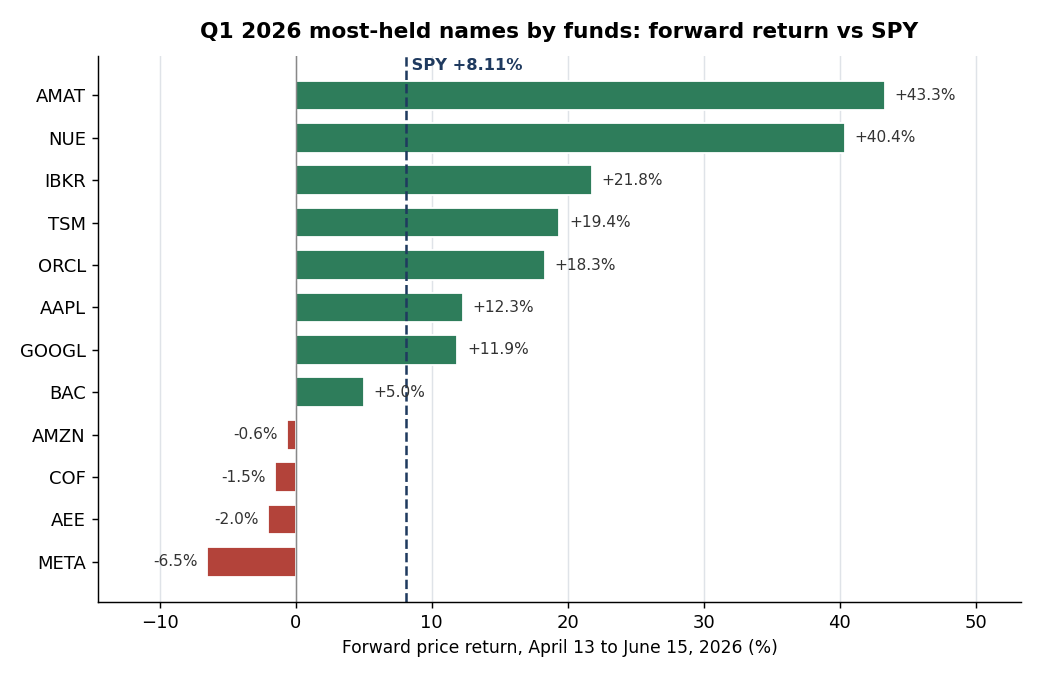
The convergence list is not uniform. The more funds that agreed on a name, the better the group behaved. We isolated the tier where seven or more distinct funds held the same long position. That is a 43-name group weighted toward mega caps, and it matches the most-named stocks at the top of the list:
- Mean forward return: 7.21 percent.
- Median: 3.11 percent.
- Hit rate: 62.8 percent.
- Best: AMAT at plus 43.3 percent. Worst: minus 22.2 percent.
The seven-plus-fund tier had a higher median and a higher hit rate than the full five-plus set. The concentration at the top of the list, the names many funds agreed on, is where the consistency lived. The long tail at the five-fund floor added return dispersion without dollar conviction.
The named heavyweights inside that tier show the spread within agreement. GOOGL, held by 16 funds with 26.6 billion dollars of tracked position, returned 11.9 percent. NUE returned 40.4 percent, AMAT 43.3 percent, IBKR 21.8 percent, ORCL 18.3 percent, and TSM 19.4 percent. AAPL, held by 7 funds with 61.0 billion dollars of tracked position, the largest dollar holding in the set, returned 12.3 percent, and BAC returned 5.0 percent. But AMZN was roughly flat at minus 0.6 percent, META fell 6.5 percent, COF fell 1.5 percent, and AEE fell 2.0 percent. Wide agreement among funds did not guarantee a winner on any single name. It tilted the distribution, it did not remove the losers.
One footnote on GOOGL: its 16-fund count is inflated by a known duplicate row in our holdings data tied to a Berkshire entry. That duplicate affects only GOOGL's rank on the convergence list, not its price return. Its 11.9 percent forward return is computed purely from price and is clean.
Key takeaways
| Measure | Convergence set (>=5 funds) | Broad-market comparison |
|---|---|---|
| Equal-weight mean return | 6.49 percent | SPY 8.11 percent |
| Median return | 2.04 percent | Broad universe 0.00 percent |
| Market-value-weighted mean | 8.46 percent | SPY 8.11 percent |
| Hit rate (share positive) | 58.1 percent | Broad universe 49.1 percent |
| Best / worst single name | EVC +195.4% / FULC -54.6% | n/a |
| Tier with >=7 funds, mean | 7.21 percent, 62.8% positive | SPY 8.11 percent |
The pattern: weighting decides the verdict. The basket led the market on breadth and edged it on dollar weighting, and lagged it only on naive equal weighting, where small-cap noise dominates.
Methodology and sources
This is Kresmion Research using the production filing-intelligence database.
Data window: the forward return is the change from the first closing price on or after April 13, 2026, to the last closing price on or before June 15, 2026, computed per ticker. SPY's last in-window close is June 12, 2026, so a few names anchor to slightly different end dates depending on data availability.
Sample: from institutional_holdings for report quarter 2026Q1, we grouped by ticker and kept tickers where COUNT(DISTINCT fund_cik) is 5 or more, restricted to long positions (put_call null or empty) and excluding the placeholder ticker CIK. That produced 841 tickers. We joined each to companies and then to company_price_snapshots through two lateral joins, the first close on or after the start date and the last close on or before the end date, to compute a price-only return, leaving 832 names with a usable forward return.
Benchmarks: SPY was computed with identical lateral-join logic. The broad-universe breadth baseline used every company that had a closing price on both ends of the window, 7,701 companies in total, measured the same way over the same dates. The exact SQL is saved with this study.
Honest limitations
This study has real weaknesses a reader should weigh.
- Stale positions. The 13F is a quarter-end snapshot dated March 31, filed with up to a 45-day lag. By the window start of April 13 the positions are already roughly two weeks old, and roughly ten weeks old by the window end. Funds may have exited before mid-April. We are measuring what happened after a snapshot, not a position anyone necessarily still held.
- No risk adjustment and no total return. Returns are price-only over about nine weeks. There is no dividend, no beta or volatility adjustment, and no transaction cost. The convergence set and the benchmark are not matched on sector, size, or risk.
- The screen is buyer-popularity, not conviction. Five tracked funds holding a long is concentration among the buyers we follow, not unanimity and not a representative sample of all institutions.
- Equal-weight fragility. The 6.49 percent equal-weight mean is heavily swung by a few hundred small and micro-cap names at the five-fund floor, where EVC rose 195.4 percent and FULC fell 54.6 percent. The median of 2.04 percent and the value-weighted mean of 8.46 percent are the more robust reads of the typical holding.
- Benchmark choice matters. SPY is a true index series in our snapshots table. The broad-universe equal-weight mean of 14.24 percent is micro-cap-skewed and not a fair central read, which is why we compare on the hit rate and the median instead. Both the broad universe and SPY are unmatched to the convergence set on sector or size.
- Coverage gap. Nine convergence tickers have no company record, and a handful more lack an in-window price, so the return set is 832 of 841, about 99 percent. The excluded names skew toward illiquid and foreign tickers.
As with any historical study, past patterns need not repeat. A two-month window in one regime is a single observation, not a rule.
For more on how we build these screens, see our methodology. We publish a running read of filings in the daily brief, and other studies live at /learn.
Frequently asked questions
So did hedge-fund favorites beat the market or not?
It depends on how you weight them. On a naive equal-weight basis the convergence basket returned 6.49 percent and lagged SPY at 8.11 percent. On a dollar or conviction weighting it returned 8.46 percent and edged SPY. And on the share of names that simply rose, it clearly led the broad market at 58.1 percent positive versus 49.1 percent for the broad priced universe. The honest summary is mixed on return level, positive on breadth.
Why measure from mid-April instead of from quarter-end?
Because mid-April is the first point a real reader could have seen the full filings. The 13F snapshot is dated March 31 but is filed with up to a 45-day lag. Measuring from April 13 reflects when the information was actually public, not when the positions were taken. It also means the positions were already roughly two weeks stale at the window start.
Why is the equal-weight average so different from the median?
Because a small number of small-cap names at the five-fund floor had enormous swings, the best up 195.4 percent and the worst down 54.6 percent. Those extremes pull the equal-weight mean up to 6.49 percent while the typical name, captured by the 2.04 percent median, moved far less. The value-weighted mean of 8.46 percent, which lets the largest positions dominate, is the most representative read of where the actual dollars went.
Did agreement among more funds help?
On this sample, yes, modestly. The tier where seven or more funds held the same name had a higher median, 3.11 percent versus 2.04 percent, and a higher hit rate, 62.8 percent versus 58.1 percent, than the full five-plus set. Greater agreement tilted the distribution toward winners, but it did not eliminate losers: even in that top tier, names like META and COF fell.
- · institutional_holdings (report_quarter 2026Q1)
- · company_price_snapshots (2026-04-13 to 2026-06-15)
- · companies
Kresmion publishes information, not investment advice. See our methodology and the latest research notes.
Kresmion is free during beta. A free account makes your watchlist permanent across devices and adds alerts when new signals fire. No card, about 30 seconds.
Start free