Study · Kresmion Research
Follow the Crowd, Do Not Fade It: What a Year of Speculative Positioning Actually Predicts
Published by Kresmion Research. Read our editorial approach and data methodology.
By Kresmion Research, July 14, 2026
Open any market commentary that mentions the Commitments of Traders report and you will find the same sentence, in one form or another: speculators are the most net long, or net short, some market in a year, so a reversal is due. The idea is old and intuitive. Speculators are supposedly the crowd, the crowd is supposedly wrong at extremes, so when positioning gets stretched you fade it. Kresmion's own daily briefs have leaned on that framing more than once.
We decided to check whether it is true. We took a year and change of speculative positioning across nine futures markets and asked a simple question with a clear answer: over the past year, would you have made money following the speculative crowd, or fading it? The result was not the one the convention predicts. Following the crowd beat fading it, the single most cited read of positioning turned out to be close to the weakest one, and the signal that did work looked different in commodities than it did in crypto. This note walks through what we found, how we tested it, and the many reasons to hold the conclusion loosely.
The convention we are testing
The Commitments of Traders report is a weekly snapshot from the US Commodity Futures Trading Commission. It breaks down who holds futures positions in a given market, and the line everyone watches is the noncommercial net position, a rough proxy for how the speculative, non-hedging crowd is leaning. When that net position reaches a one year high or low, it gets written up as an extreme, and the standard interpretation is contrarian: the crowd is all on one side, so the trade is crowded, so it is about to unwind. If you want the mechanics of the report itself, we wrote a separate primer on what net long positioning means.
There are really two questions hiding inside the convention, and almost nobody separates them. The first is direction: should you follow positioning or fade it? The second is which feature of positioning carries the information: the level, meaning how net long or short the crowd is right now, or the velocity, meaning how fast the crowd is adding to or cutting its position. The headline number is a level. The reversal story is a fade. We tested both questions across every market we could match to a clean return series.
What we tested, in plain terms
We used the weekly COT net position for nine liquid futures markets: the S&P 500, the Nasdaq 100, gold, silver, WTI crude, natural gas, bitcoin, the 10 year Treasury note, and the euro. For each one we lined the positioning data up against the actual forward return of a matching, tradeable proxy, an exchange traded fund or index for each market, over the following one, two, and four weeks. The sample runs from May 2025 to July 2026, which is 62 weekly reports and 558 market weeks of data.
Two details matter for honesty. First, the COT report describes positioning as of a Tuesday but is not published until the following Friday, so we only ever let the strategy act on information it could actually have known, measuring returns from the Friday release onward. There is no peeking at data before it existed. Second, we measured predictive power with a standard tool called the information coefficient, which is just the rank correlation between a signal and the return that follows it. An information coefficient of zero means the signal told you nothing. A positive number means following the signal worked. A negative number means fading it worked. In noisy weekly data like this, a coefficient around 0.05 to 0.10 is a small but real edge, and anything above 0.20 is strong for a single input.
Result one: the extreme is the weakest read
Start with the exact number the convention is built on, the stretched level. We measured how extreme each market's positioning was relative to its own recent history, the same rolling gauge that produces the one year high and low headlines, and asked whether the most stretched markets went on to reverse.
They barely did. Ranked across markets each week, the stretched level had an information coefficient of about minus 0.13 against the next week's return, and it faded toward zero by the four week mark. The minus sign means it leaned contrarian, which is the direction the convention wants, but the size is tiny and it lives almost entirely at the one week horizon. It is also the kind of result that does not survive much scrutiny. We tested several signals across three horizons, and a single mild reading like this is roughly what you would expect to find by chance once you go looking across that many combinations. In plain terms, the famous extreme is real, but as a standalone reason to bet on a reversal it is close to noise.
That is the first surprise. The most quoted feature of the most quoted positioning report is the feature that predicted the least.
Result two: the crowd was momentum, not contrarian
Now flip from the stretched level to the plain level, meaning simply whether the crowd is net long or net short, and ask the direct question: follow or fade?
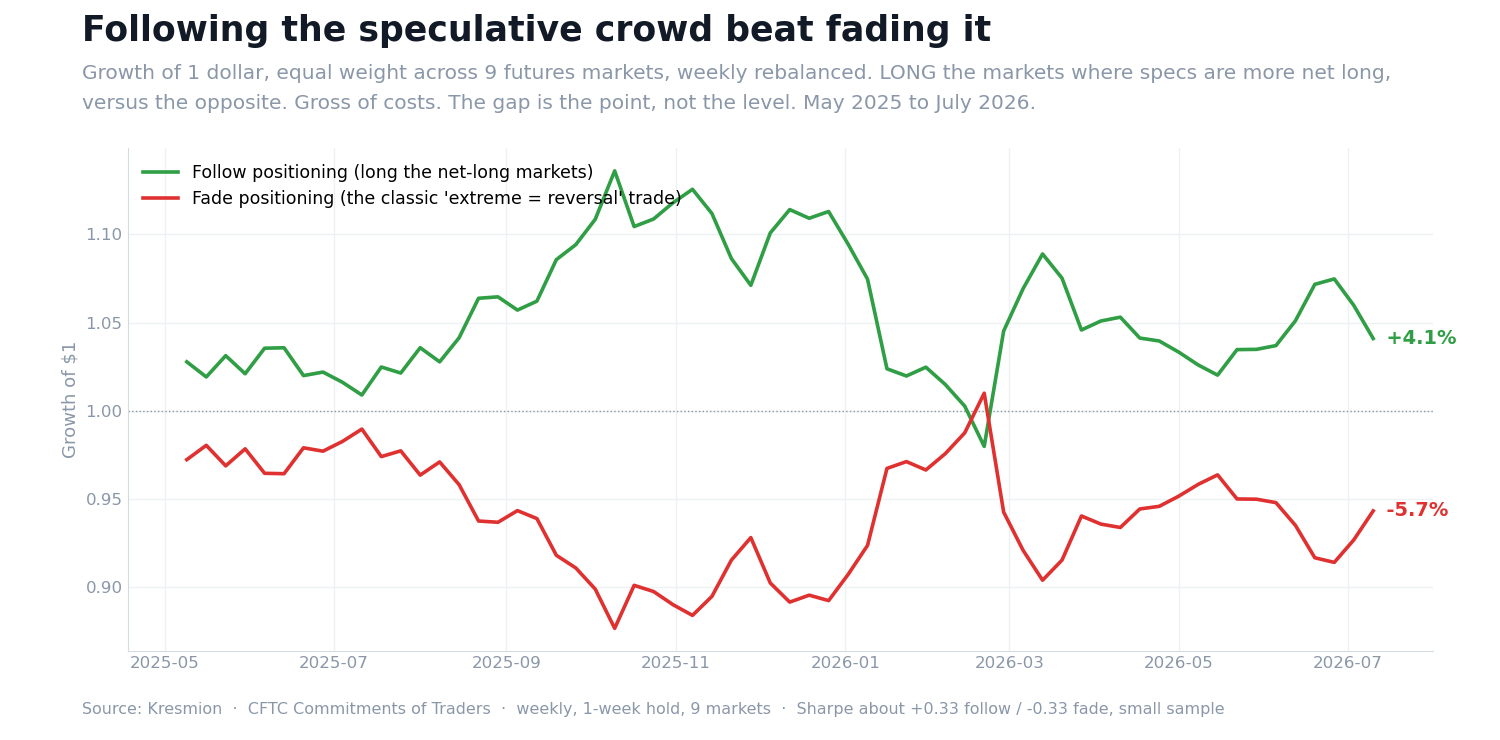
The chart above runs the simplest version of both trades. Each week we take an equal weighted basket of the nine markets. The green line goes long the markets where speculators are more net long and short the ones where they are more net short, which is following the crowd. The red line does the exact opposite, which is the classic fade. Over the 62 weeks, following the crowd returned about 4 percent while fading it lost about 6 percent, for a Sharpe ratio near plus 0.33 and minus 0.33 respectively, before costs. These are small numbers and the two lines cross in early 2026, so this is not a money machine. But the sign is unambiguous and it runs against the folklore. For this sample, the speculative crowd was closer to smart money than to dumb money. The people betting that a heavy net long position had to unwind were the ones who bled.
Result three: there is no single positioning signal
Here is where it gets more useful and more honest at the same time. The follow versus fade result is an average across very different markets, and the average hides the real structure. When we split the nine markets into asset classes and asked which feature of positioning predicted the next four weeks of returns, the answer changed completely depending on what you were trading.
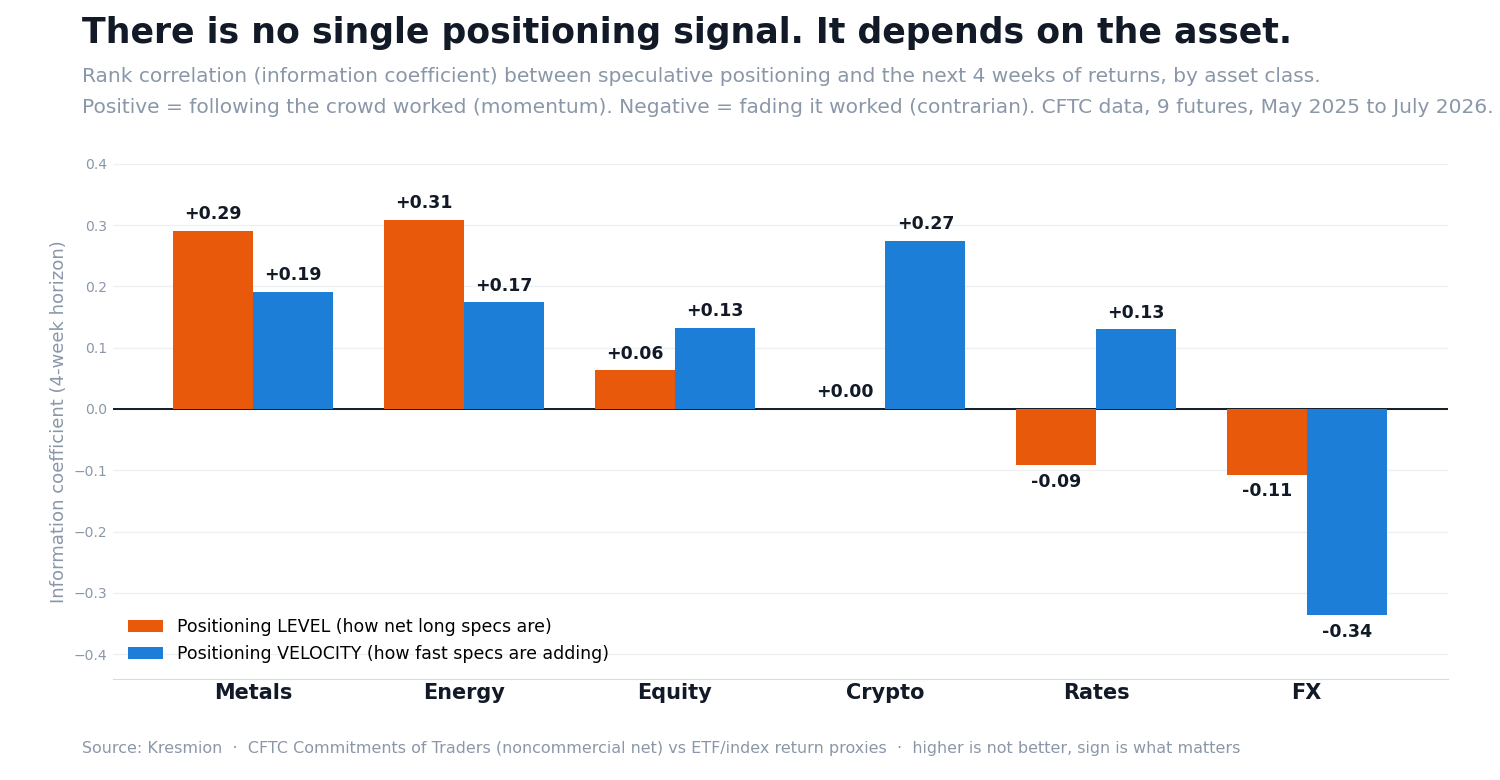
Read the chart as two questions per asset class. The orange bar asks whether the level of positioning predicted returns. The blue bar asks whether the velocity, the rate at which the crowd was adding, predicted returns. Positive means follow, negative means fade.
Three distinct regimes show up.
In commodities, the level is what matters and it is momentum. In metals and energy, the plain level of positioning had an information coefficient of about plus 0.29 and plus 0.31 against the next month. When speculators were net long gold or crude, gold and crude tended to keep going, and the effect is among the strongest in the whole study. Gold and crude individually posted coefficients above plus 0.42. Positioning in a physical commodity behaves like a slow trend that takes weeks to play out, and the crowd tends to be on the right side of it.
In crypto and rates, the level is useless and the velocity is the signal. Bitcoin is the sharpest example. Whether speculators were net long bitcoin told you essentially nothing about its next month, an information coefficient of zero. But how fast they were adding told you a lot, a coefficient of about plus 0.27. The 10 year Treasury note showed the same shape, with the level slightly negative and the velocity clearly positive. In these faster or more crowded markets, the standing position is stale by the time you read it. What carries information is the change.
In FX, you fade. The euro was the one clean market where both the level and the velocity had negative coefficients, meaning the crowd was late and wrong, with the velocity at about minus 0.34. Currency futures sit inside the most heavily arbitraged macro market on earth, and it shows: the speculative crowd there looks more like the last one through the door.
Equities landed in between, with a weak positive tilt that showed up more in velocity than in level.
So the tidy version of the convention, one number, one direction, applied everywhere, is wrong three different ways at once. The direction is mostly follow, not fade. The feature that matters is the level in commodities but the velocity in crypto and rates. And the one market that actually rewards fading is the one the convention rarely talks about.
| Asset class | Follow the level? | Follow the velocity? | Read |
|---|---|---|---|
| Metals | Yes, strong (+0.29) | Yes (+0.19) | Trend, follow the crowd |
| Energy | Yes, strong (+0.31) | Yes (+0.17) | Trend, follow the crowd |
| Crypto | No (+0.00) | Yes, strong (+0.27) | Watch the change, not the level |
| Rates | No (-0.09) | Yes (+0.13) | Watch the change, not the level |
| Equity | Weak (+0.06) | Yes (+0.13) | Mild momentum, prefer velocity |
| FX | No (-0.11) | No (-0.34) | Fade the crowd |
Why the pattern looks like this
A pattern with no mechanism is a coincidence waiting to break, so it is worth asking why positioning would behave this way, while being clear that this is interpretation, not proof.
The commodity result fits how those markets actually work. Positioning in gold, silver, oil, and gas tracks slow moving stories about physical supply and demand, and those stories take weeks or months to resolve. A speculative long that builds as inventories draw down is not a crowded contrarian setup, it is the crowd correctly reading a trend that is still running. The level works because the level reflects a slow fundamental, and the crowd is trend following in exactly the markets where trends are real and persistent.
The crypto and rates result fits a different logic. In markets where flows turn over quickly, the standing net position is mostly old news, already reflected in price by the time it is reported with its built in lag. What is not yet reflected is the fresh flow, the direction the crowd is moving this week. That is why the change, and not the level, carries the information there.
FX is the market that has been arbitraged the longest and the hardest, with the deepest institutional participation and the tightest links to central bank policy. In that environment the speculative futures crowd is a smaller and later voice, and a positioning extreme is more likely to mark the exhaustion the convention imagines. The convention is not wrong everywhere. It is just mostly right in the one corner nobody quotes it about.
What we are not saying
This is a small study and it would be dishonest to dress it up as more. The sample is 62 weeks, a little over a year, and that year was one macro regime, broadly a period of firm commodities and risk taking. A momentum result in a trending year is exactly what you would expect to find whether or not the effect is durable, and the honest test is whether it survives a very different regime, which this data cannot tell us. The effect sizes are modest. Outside of commodities the information coefficients sit between 0.1 and 0.3, which is a real edge but a small one, and the follow versus fade return was a few percent, before any trading costs, which would eat into it. Several of the asset classes rest on a single market, so crypto is bitcoin alone, rates is the 10 year alone, and FX is the euro alone, which means those class level numbers are suggestive rather than settled. Our euro return proxy leans on the dollar index rather than the pair itself, another rough edge. And we looked at several signals across several horizons, so some of what we found is the ordinary noise of searching. None of this erases the core shape of the result, but all of it argues for using the finding as a lens, not a system.
How to read a positioning headline now
The practical takeaway is not a trade, it is a better way to read a familiar number. When you next see that speculators are at a one year extreme in some market, three questions are worth more than the headline. Which asset class is it, because commodities and FX point opposite ways. Is the story about the level or the change, because in crypto and rates only the change has mattered. And which direction does the crowd being early or late actually imply here, because the reflexive fade has been the wrong instinct in most of these markets over the past year. The extreme on its own, the part that makes the headline, has been the least informative piece.
What would change this conclusion
We would take the momentum result far more seriously if it held through a genuine risk off regime, a stretch where commodities fell and positioning stayed long into the decline, because that is the environment where the classic contrarian fade is supposed to earn its keep and where a naive trend follower gets hurt. We would abandon the asset class split if it failed to reproduce on a longer history or on the individual futures contracts rather than ETF proxies. And we would revisit the whole framing if the velocity effect in crypto disappeared once bitcoin's own market matured, which is the kind of edge that tends to decay as a market gets more institutional. Until one of those things happens, the evidence in front of us says the same thing the chart says. For the past year, in these markets, the crowd was worth following more often than fading, and the extreme everyone quotes was the last thing worth trading on.
Method and reproducibility
Data: CFTC Commitments of Traders, noncommercial net positions, weekly, for nine markets, May 2025 through July 2026, joined to weekly returns of matching liquid ETF or index proxies. Level is net position as a share of open interest, plus a 26 week rolling standardization for the extreme gauge. Velocity is the four week change in net position scaled by open interest. Predictive power is the Spearman rank information coefficient of each signal against forward one, two, and four week returns, computed both across markets each week and within each market over time. Signals act only on the Friday release date to avoid look ahead. The follow versus fade portfolio is equal weighted across the nine markets, rebalanced weekly, one week hold, gross of costs. All figures are computed from Kresmion's own stored COT and price history.
Sources
Kresmion COT dataset (CFTC Commitments of Traders, noncommercial net, 9 markets, 62 weekly reports, May 2025 to July 2026).
Kresmion price history (weekly returns of SPY, QQQ, GLD, SLV, USO, UNG, bitcoin, IEF, and the US dollar index as market proxies).
US Commodity Futures Trading Commission, Commitments of Traders report. https://www.cftc.gov/MarketReports/CommitmentsofTraders/index.htm
Kresmion primer on speculative positioning: /learn/what-is-cot-net-long-positioning
Read the futures curve in context
Compare delivery-month prices with positioning and seasonal history. The curve describes prices for different contracts; it does not promise a future spot price or an investment return.
- Contango and backwardation explained
- Compare futures curves
- Explore CFTC futures positioning
- Compare monthly seasonality
Primary-source background: CME Group: contango and backwardation. Kresmion methodology and limitations.
- · Kresmion COT dataset (CFTC Commitments of Traders, noncommercial net, 9 markets, 62 weekly reports, May 2025 to July 2026).
- · Kresmion price history (weekly returns of SPY, QQQ, GLD, SLV, USO, UNG, bitcoin, IEF, and the US dollar index as market proxies).
- · US Commodity Futures Trading Commission, Commitments of Traders report. https://www.cftc.gov/MarketReports/CommitmentsofTraders/index.htm
- · Kresmion primer on speculative positioning: /learn/what-is-cot-net-long-positioning
Current commercial and non-commercial net positioning across the CFTC futures markets, with each market's percentile against its own history.
Free to view, no account needed.
Put this to work
Real filings, 13F flows, and positioning reads with the source on every number, in your inbox when there is something in the data, or live on Telegram. Free, no account.
No fixed schedule: it goes out when the data has something in it. Unsubscribe anytime.
Kresmion publishes information, not investment advice. See our methodology and the latest research notes.