
Explainer · Kresmion Research
What Is COT Net-Long Positioning, and How Do You Read It?
COT net-long positioning is non-commercial long futures contracts minus short contracts, a weekly CFTC measure of how speculators are positioned in a market.
The Commitments of Traders (COT) report is one of the most widely watched positioning datasets in futures markets. This page explains what "net-long" means, how the COT splits traders into groups, and how Kresmion converts the raw numbers into comparable measures across markets. It is descriptive throughout: it explains how the report is read, not what to do with it.
What the COT report is
The COT report is a weekly breakdown of open interest in U.S. futures and options markets, published by the U.S. Commodity Futures Trading Commission (CFTC) to show how different trader types are positioned. *Open interest* is simply the total number of futures contracts outstanding in a market at a given time, and the COT divides that total across trader categories.
The report is released every Friday at 3:30 p.m. ET using positions held as of the preceding Tuesday, and it covers markets where 20 or more traders hold reportable positions (CFTC). Because Tuesday positions are not published until Friday, every COT figure carries a roughly three-day reporting lag. Each report is also a snapshot of a single Tuesday; positioning is revised every week, so the figures below illustrate one report date rather than a standing condition.
The three trader groups
The legacy COT scheme splits reportable open interest into two groups, with a residual third:
- Commercial traders (hedgers). Positions are classified commercial when a trader uses futures for hedging as defined in CFTC Regulation 1.3, generally by filing Form 40 stating they are commercially engaged in a business hedged through futures or options. These are typically producers and consumers offsetting underlying business risk (CFTC Explanatory Notes).
- Non-commercial traders (speculators). Reportable traders who do not qualify as commercial. They hold positions to profit from price moves rather than to hedge a physical business. Classification follows the self-reported predominant business purpose on Form 40, subject to CFTC staff review (CFTC Explanatory Notes).
- Nonreportable (retail). Small traders whose positions fall below CFTC reporting thresholds. They are derived by subtracting total reportable longs and shorts from total open interest; their count and their commercial/non-commercial split are unknown (CFTC Explanatory Notes).
How net-long positioning is computed
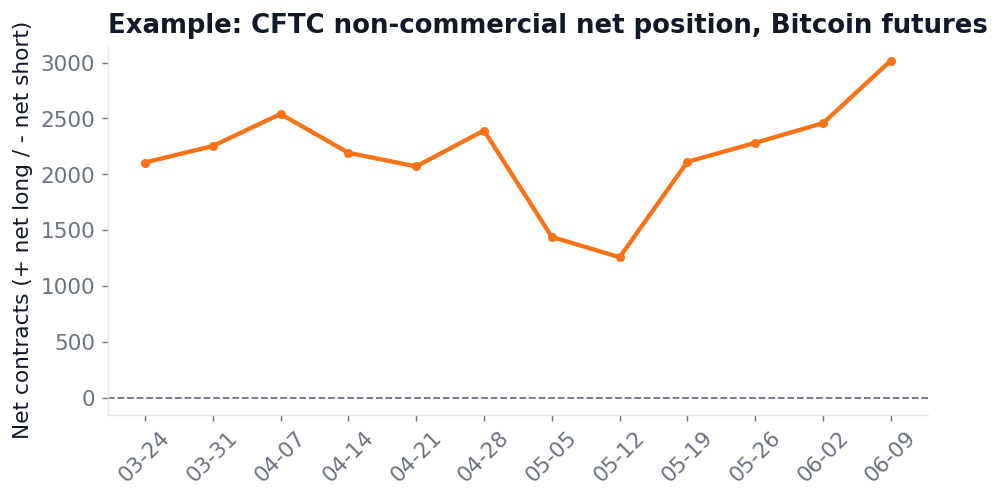
Non-commercial net (net-long positioning) is non-commercial long contracts minus non-commercial short contracts. A positive value means speculators are net long; a negative value means net short. In Kresmion's COT dataset, the computed value (non-commercial long minus short) matches the stored net figure exactly across all 13 tracked markets, which span major commodities, rates, equity-index, and currency futures.
Key takeaways
| Metric (as of June 9, 2026) | Value |
|---|---|
| Bitcoin non-commercial net | +3,018 contracts (15.26% of OI), z-score +2.49 |
| Natural gas non-commercial net | +253,130 contracts (64.85% of OI), z-score +2.32 |
| Gold non-commercial net | +173,837 contracts (52.25% of OI), z-score +1.48, no signal |
| Markets flagged NET_LONG_EXTREME | 2 of 13 (Bitcoin, natural gas) |
| Bitcoin commercial net | -2,906 contracts (the mirror side of speculators) |
Normalizing for market size: % of open interest
A raw contract count is hard to compare across markets of different sizes. The "% of open interest" measure divides non-commercial net by total open interest and multiplies by 100. In Kresmion's COT dataset, this normalized value matches the stored figure to exact precision.
As of June 9, 2026, Bitcoin non-commercial net was 15.26% of open interest, while natural gas non-commercial net was 64.85% of open interest. So natural gas positioning was far more lopsided relative to its own market size, even though both markets carried similar net-long readings on the standardized z-score scale.
How unusual is today? The 52-week z-score
The 52-week z-score measures how far current net positioning sits from its own trailing one-year mean, expressed in standard deviations. It answers how unusual today's positioning is relative to a market's own recent history, independent of absolute size. Kresmion's COT system flags any reading where the absolute z-score is 2.0 or greater as an extreme.
As of June 9, 2026, Bitcoin carried a z-score of +2.49 and natural gas +2.32, and both were flagged NET_LONG_EXTREME. Gold, by contrast, showed a large net long of +173,837 contracts (52.25% of open interest) but a z-score of only +1.48, so it carried no signal. Large net longs are normal for gold, and raw size alone does not trigger the flag. Across all 13 tracked markets, only Bitcoin and natural gas crossed the extreme threshold on that date.
Reading two examples together
Bitcoin and natural gas illustrate why both raw and normalized measures matter. As of June 9, 2026, both carried the same NET_LONG_EXTREME signal (z-scores between +2.3 and +2.5) but very different footprints: Bitcoin at +3,018 contracts and 15.26% of open interest, versus natural gas at +253,130 contracts and 64.85% of open interest. The z-score equalizes them by measuring each market against its own 52-week norm.
The structural feature COT reading relies on is that hedgers take the other side of speculative flow. As of June 9, 2026, Bitcoin commercials sat at a net of -2,906 contracts, a near-mirror of the +3,018 speculative net long. Commercial and non-commercial nets typically move in opposite directions for this reason.
Net-short positioning
The same arithmetic produces net-short readings when speculators hold more shorts than longs. As of June 9, 2026:
- JPY/USD non-commercial net was -145,818 contracts (-28.87% of open interest).
- 10Y T-Note net was -863,807 contracts (-16.45% of open interest).
- S&P 500 mini net was -205,644 contracts (-9.33% of open interest).
A negative value means speculators are positioned net short.
How the report is commonly read
COT is read as a sentiment and positioning gauge. A crowded net-long or net-short extreme is sometimes read as a contrarian signal, on the logic that positioning that one-sided has fewer marginal participants left to extend the trend. This describes common practice; it is not investment advice.
It also has real limits (CFTC Explanatory Notes):
- It lags. The data is about three days old by the time it is published.
- It is aggregate, not individual. Single-trader classifications are not published.
- Category lines are self-reported and imperfect. A trader can be partly hedging and partly speculating.
- Extremes can persist. Positioning can stay crowded, or grow more crowded, for long stretches inside a strong trend.
- The legacy split is coarse. The commercial/non-commercial breakdown is broader than the newer Disaggregated (Managed Money and others) and Traders-in-Financial-Futures (Leveraged Funds and others) schemes.
An extreme marks crowding, not timing.
Frequently asked questions
What does "net long" mean in the COT report?
Net long means a trader group holds more long contracts than short contracts. For non-commercial traders it is computed as non-commercial longs minus non-commercial shorts; a positive number is net long and a negative number is net short.
How often is the COT report published, and how current is it?
The CFTC publishes the COT every Friday at 3:30 p.m. ET, using positions held as of the preceding Tuesday (CFTC). That means every figure reflects positioning from about three days earlier.
Why use a z-score instead of the raw contract count?
A z-score measures positioning against each market's own 52-week history, so markets of very different sizes can be compared on one scale. As of June 9, 2026, Bitcoin and natural gas carried similar z-scores (+2.49 and +2.32) despite wildly different absolute net positions.
Does an extreme net-long reading predict a price move?
No. An extreme marks crowded positioning, not a forecast or a timing tool, and such extremes can persist for weeks. The COT reflects positioning, not price direction.
---
Source: Kresmion COT dataset (CFTC Commitments of Traders, legacy scheme), latest report date June 9, 2026. This page is information, not investment advice. Kresmion Research.
- · https://www.cftc.gov/MarketReports/CommitmentsofTraders/index.htm
- · https://www.cftc.gov/MarketReports/CommitmentsofTraders/ExplanatoryNotes/index.htm
Kresmion publishes information, not investment advice. See our methodology and the latest research notes.
Kresmion is free during beta. A free account makes your watchlist permanent across devices and adds alerts when new signals fire. No card, about 30 seconds.
Start free