Study · Kresmion Research
Same Question, Different Price: Seven Polymarket and Kalshi Pairs, One Live Gap
Published by Kresmion Research. Read our editorial approach and data methodology.
# Same Question, Different Price: Seven Polymarket and Kalshi Pairs, One Live Gap
Kresmion Research
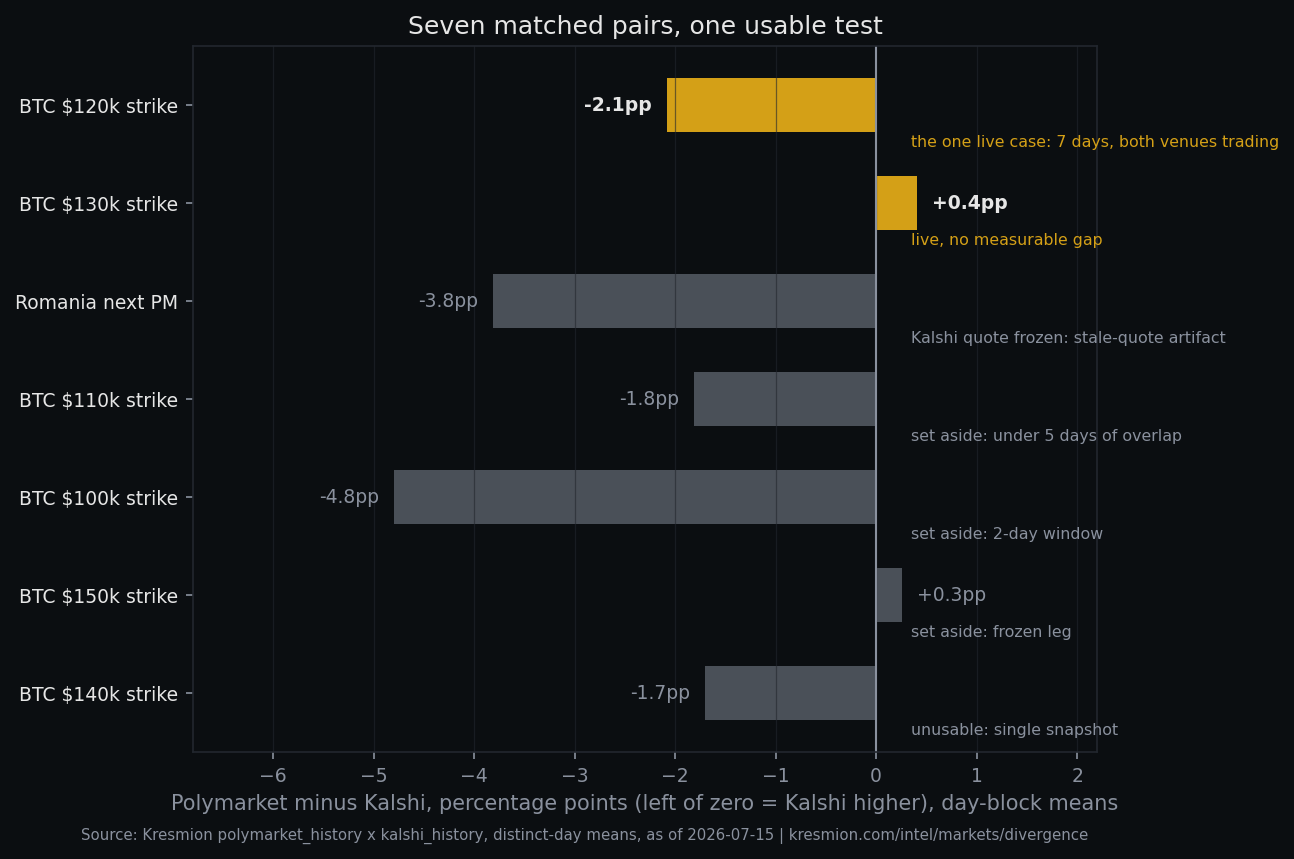
When Polymarket and Kalshi list the same real-world question, do they price it the same way? We checked the seven question pairs Kresmion currently matches across both venues. The honest answer is that on most of these pairs we cannot even run the test, because one venue's quote sits frozen or the two books overlap on only a single day. On exactly one pair, a Bitcoin year-end price contract where both venues were actively trading and densely sampled, Kalshi's yes price sat about 2 percentage points above Polymarket's for one contiguous week (2026-07-01 to 07-07) and did not close over that week. That single pair is the closest thing in our data to a live, two-venue disagreement, and even it is one week-long episode rather than a repeatable result, measured on a Polymarket quote that only ever sat on two adjacent penny prices.
So the takeaway is deliberately narrow. Of our seven pairs, six are rungs of one underlying market (Kalshi's Bitcoin year-end price ladder), so we really have two question families, not seven independent tests. Most pairs fail a basic quality check: the eye-catching 3.8 point gap on Romania's next prime minister is measured against a Kalshi quote that never moved once across the whole window, so it is a lesson about stale quotes, not a two-venue disagreement. At least one live Bitcoin rung shows no gap at all. What is left is a single case: on the best-sampled live pair, a roughly 2 point gap held for a week and did not arbitrage away over that week. Even there the gap is only about two 1-cent ticks wide and sat frozen at exactly 2 points on three of the seven days, so part of it is tick rounding rather than measured disagreement, and we cannot cleanly separate the two. We do not have enough independent, live, well-sampled pairs to call any of this a general pattern, and every number here is a moving target. Past patterns like these need not repeat.
Key takeaways
| Takeaway | Detail |
|---|---|
| Most pairs cannot test agreement | Of 7 matched pairs, 6 are rungs of one Bitcoin market and most have a frozen or single-day leg. Only 1 pair had both venues actively trading and densely co-sampled. |
| The one live case | Bitcoin $120k year-end strike: Kalshi priced about 2.08 points above Polymarket across one contiguous week (2026-07-01 to 07-07), Kalshi higher. Both legs traded. |
| The one gap is about two ticks wide | On that live pair Polymarket sat on only two adjacent penny prices (0.0450 and 0.0550), and the gap held at exactly 2 points with no intraday movement on three of the seven days, so part of it is tick quantization, not measured two-venue disagreement. |
| It is one episode, not seven draws | The seven daily gaps come from a single persistent week, so they are autocorrelated, not seven independent observations. We report the sign test and interval as suggestive, not as proof the gap is significant. |
| It did not close that week | Over the single observed week the gap stayed near 2 points rather than shrinking to zero. That says nothing about whether it survives to the December 31 settlement roughly six months out. |
| The flashy 3.8 point case is fragile | The Romania next-PM gap is measured against a frozen Kalshi quote (one price, one volume value across roughly 500 snapshots), so it is illustrative, not proven. |
| Frictions, not measured arbitrage | Gaps are last or mid quotes with no fees or depth. We cannot show any after-cost profit, and we cannot test why a gap persists, so structural frictions are a conjecture, not a measured result. |
How we matched the two venues
We match questions across venues with a curated links table. As of 2026-07-15 it holds exactly seven active pairs: six rungs of Kalshi's Bitcoin year-end price ladder (the KXBTCMAXY-26DEC31 series), each mapped to its Polymarket twin, plus the Romania next-prime-minister market. For each pair every Polymarket snapshot is matched to its single closest Kalshi snapshot within 30 minutes; the gap is Polymarket yes-probability minus Kalshi yes-probability, both on the same 0 to 1 scale, so a negative gap means Kalshi priced the question higher. The Polymarket side is tracked at /intel/polymarket.
Because that 30-minute tolerance is loose for a volatile Bitcoin underlying, we also record how far apart each matched pair of snapshots actually was, since a multi-minute stale leg could manufacture or inflate a gap during an intraday Bitcoin move. On the one live pair the average distance between a Polymarket snapshot and its matched Kalshi snapshot is 4.4 minutes (the widest single match is 23.7 minutes), and Romania matches equally tightly at 4.4 minutes on average. The set-aside pairs match far looser: 17.8 minutes on average for the $110k rung and 22.2 minutes for the single $140k point, which is one more reason we do not lean on them. Crucially, tightening the live pair's tolerance to under five minutes leaves its mean gap essentially unchanged (from -2.08 to -2.02 points, still across all seven days), so the one gap we report is not an artifact of a stale matched leg.
Two features of the raw data forced us to be strict. First, an earlier plus-or-minus 30 minute join was many-to-many, so it counted each Polymarket snapshot several times (the "396 observations" on the $120k pair is really 209 distinct snapshots; the "2" on the $140k pair is one snapshot matched twice). Second, snapshots minutes apart are not independent, so the honest unit is a distinct day, and days are few (1 to 8 per pair). We therefore build uncertainty from distinct-day means, not tick counts, and require each pair to pass a live-leg screen (both sides show more than one distinct price with moving volume) and a coverage screen (at least five co-observation days) before calling any gap real. We should be plain that these screens were chosen after we had already seen which pairs looked clean, so they are descriptive filters, not a pre-registered rule, and the "more than one distinct price" bar is a low one. Only two of the seven pairs clear both screens, which leaves too few to treat the screening itself as a real out-of-sample test.
What the seven pairs actually show
| Matched question | Gap, Poly minus Kalshi (day-block mean) | Honest sample | Window | Both legs live? | Verdict |
|---|---|---|---|---|---|
| BTC $120k year-end strike | -2.08 pts (Kalshi higher) | 7 days / 209 snapshots | 2026-07-01 to 07-07 | Yes, Poly coarse (2 prices) | One live week-long episode; partly a tick artifact (single case) |
| BTC $130k year-end strike | +0.41 pts | 8 days / 61 snapshots | 2026-05-30 to 06-06 | Yes | No measurable gap (interval straddles zero) |
| Romania next PM | -3.81 pts | 4 days / 99 snapshots | 2026-07-01 to 07-15 | No, Kalshi leg frozen | Stale-quote illustration only |
| BTC $110k year-end strike | -1.81 pts | 4 days / 8 snapshots | 2026-06-01 to 07-15 (scattered) | Yes | Set aside: under 5 days |
| BTC $100k year-end strike | -4.80 pts | 2 days / 8 snapshots | 2026-07-14 to 07-15 | Short window | Set aside: 2 days, mean not robust |
| BTC $150k year-end strike | +0.26 pts | 2 days / 5 snapshots | 2026-07-14 to 07-15 | No, Kalshi leg frozen | Set aside: frozen leg |
| BTC $140k year-end strike | -1.70 pts | 1 day / 1 snapshot | 2026-07-14 | No | Unusable: single data point |
The one live case. On the Bitcoin $120,000 year-end strike, Kalshi's yes price sat above Polymarket's by an average of about 2.08 percentage points across seven distinct days (2026-07-01 to 07-07). This is the only pair where both venues were genuinely active: Kalshi printed six distinct prices with contract volume rising from about 502,000 to 509,000, and Polymarket's dollar volume rose from about 978,000 to 1,017,000. Treat this as one honest observation, though, not seven. The gap is the kind this study is about, and it did not close over the week we saw it, but two cautions keep it from being a clean result.
First, the seven daily gaps are not seven independent draws. A gap that "sits still" for a week is by definition serially correlated: knowing Monday's gap tells you most of Tuesday's. If we nonetheless treated the seven daily means as independent, all seven are negative, a two-sided sign test would read p = 0.0156, and a day-level 95 percent interval would run from -2.52 to -1.63 points, excluding zero. But that independence is exactly what a persistent gap violates, so the effective sample is closer to one week-long episode than to seven, and those figures overstate the evidence. We report them as suggestive, not as proof the interval excludes zero. On top of that, we picked this pair after screening all seven, and even a crude seven-way correction for that would push the nominal 0.0156 past the usual 0.05 line. We do not attach a trend claim either: a line fitted to seven autocorrelated daily points slopes slightly away from zero rather than toward it (about -0.17 points per day), which is why we say the gap did not close within the week, but with so few effectively independent points we do not read a reliable trend into it.
Second, the winning leg is coarser than it looks, and this is the central weakness of the one surviving case. Over the whole week Polymarket printed only two distinct prices, 0.0450 and 0.0550, one 1-cent tick apart (40 ticks at the lower price, 170 at the higher). That is one step away from the frozen single-price quotes we disqualify elsewhere, so this pair clears our "more than one distinct price" screen by the thinnest possible margin. Kalshi was livelier, taking six distinct prices over the week, but the gap between the two books is itself only about two 1-cent ticks wide (Polymarket sitting mostly at 5.5 cents against Kalshi mostly at 7.5 cents), and on a plurality of the days the gap did not move at all: on 07-03, 07-04 and 07-05 every matched snapshot differenced to exactly -0.0200, with zero intraday variation. So the average 2.08 point gap is within rounding of a single 2-cent tick offset between two sticky quotes. We cannot show that the gap exceeds what tick alignment alone can produce, so we do not read it as a clean economic disagreement; part of it, and possibly most of it, is tick quantization rather than two active books declining to close a real spread. What keeps the pair from being a pure staleness artifact like Romania is that both books' dollar and contract volume moved over the week and the match is tight (average 4.4 minutes between paired snapshots, mean gap unchanged at -2.02 points inside a five-minute window), so the gap is not manufactured by differencing a stale leg. But "both books traded" and "the price gap itself was frozen on most days" are both true here, which makes the live-versus-stale line softer than a clean split. Finally, the window ends 07-07 not because we chose to stop there but because the Polymarket leg for this market has no dense sampling after 07-07 (only two stray snapshots on 07-14); 07-01 to 07-07 is the full co-observation episode, not a selected sub-window. So the honest summary is one live pair, one roughly 2 point gap that is partly a tick artifact, one week, one episode.
The clean non-gap. The $130,000 strike is the counter-example that keeps us honest. Both legs traded (Kalshi twelve distinct prices, Polymarket ten) over eight distinct days, and the average gap was +0.41 points with a day-level interval from -0.58 to +1.40 points, which straddles zero; the daily signs split evenly, four negative and four positive. Here the two venues simply agreed, which is what our falsification test looks for: a well-sampled live pair whose interval includes zero is not a gap. With only two pairs clearing our screens, though, this is a single illustrative counter-case, not a powered test.
The stale-quote trap. The most eye-catching number, and the most misleading, is Romania. The raw gap held near 3.8 points with astonishingly tight dispersion (about 0.16 of a point), so it looks like the most stable finding in the study. It is not. Across the window the Kalshi leg took exactly one price (0.0600) and one volume value (125 contracts) across roughly 500 snapshots: the Kalshi side never traded. A gap measured against a frozen resting quote is not a two-venue equilibrium, and the famous tightness is a staleness signature, not a confidence one. Romania also spans only four distinct days (three in early July, then one day on 07-15 after an eleven day hole), so even a perfectly one-signed series reaches only sign-test p = 0.125. We report it as a cautionary illustration with no confidence claim. The $150,000 rung has the same frozen-Kalshi problem, so we set it aside too.
Two more points keep the headline modest. Five of the seven pairs have Kalshi priced higher on average, but two do not, and each sits in a different, non-overlapping window, so "most questions higher" is a count of pair averages, not a claim about one moment. And six pairs are rungs of one underlying (the Bitcoin year-end price), so we really have two independent question families, not seven, which is why the one affirmative finding is a single case rather than a one-in-seven base rate. You can watch the live picture on Kresmion's divergence monitor and quotes at /odds.
Why a gap like this can persist without being free money
Everything in this section is conjecture, not measurement. Our two tables carry only a yes-probability and a volume figure for each venue; they hold no fees, no bid or ask, no spread, no order-book depth, and no collateral-yield data. So we can observe that a gap persisted, but we cannot test why it persisted, and nothing below is a result we measured. Our "falsification" step is narrower than it sounds too: it only checks whether a given pair shows a persistent nonzero gap or whether its interval includes zero. That describes the gap; it does not test the claim that frictions cause it. To actually test the frictions story we would need fee, depth and carry data we do not have, so treat the mechanisms below as a menu of candidate explanations, each consistent with both venues being efficient, not as forces we weighed.
So why might two venues quote the same question differently for a week without traders closing the gap? Real arbitrage needs the same payoff, no cost, no risk, and simultaneous execution in size, and between Polymarket and Kalshi several of those conditions could break at once, which is why economists call this "limits to arbitrage" (Shleifer and Vishny, 1997). Each venue charges its own fees: Kalshi's taker fee follows a published formula that peaks for contracts priced near 50 cents and shrinks toward the penny and 99 cent extremes (Kalshi Fee Schedule), and Polymarket's own fee arrangements differ, so the two legs would not cost the same to trade. Capital is locked in both legs until the December resolution, and the yield foregone on that collateral is a carry that could rival a few points over a multi-month horizon (Maresca, 2026). The venues are also legally segmented: Kalshi is a CFTC-regulated US venue settling in dollars with full identity checks, Polymarket an offshore venue settling in USDC that restricts US users (Congressional Research Service), so the two books could serve largely different crowds who cannot easily arbitrage each other. Add currency differences and the risk that a gap widens before it closes, and a durable gap could be an equilibrium rather than free money on the table. We list these as candidates only. We did not measure any of them, and our data cannot tell you which, if any, is actually at work here, or indeed whether the small gap we saw is anything more than tick rounding.
This is not just our data. An independent January 2026 study of more than 100,000 events across ten venues found "persistent execution-aware price deviations of 2 to 4 percent on average, even in highly liquid and information-rich settings," and attributed them to structural frictions rather than disagreement about the answer (Gebele and Matthes, 2026). We read this as support for the qualitative claim, that cross-venue gaps of a few points persist across many venues and are frictional, rather than as a match to our exact number. The two magnitudes are not measured the same way: their deviation is execution-aware, meaning after trading costs, while our gap is a raw last or mid quote before any costs. A post-cost deviation of a few points and a pre-cost gap of a few points are different objects, so we cannot say the sizes corroborate each other, only that gaps of this order are a recognized, frictional feature of these markets. It is worth stressing what we cannot claim. Because these contracts are not yet resolved (the Bitcoin ladder settles December 31, the Romania market is pending), we cannot say which venue is more accurate or better calibrated. A price is a market-implied probability shaped by fees and the time value of locked money, not a poll of true beliefs, and judging accuracy needs resolved outcomes (Wolfers and Zitzewitz, 2004). For a plain-language primer on reading prices as probabilities, see how prediction markets price the Fed.
Methodology and sources
Method statement. We match questions with a curated links table (seven pairs as of 2026-07-15: six rungs of Kalshi's Bitcoin year-end price ladder plus one Romania next-PM market). For each pair every Polymarket snapshot is matched to the single closest Kalshi snapshot within 30 minutes; snapshots with no neighbour are dropped and none is reused. The gap is Polymarket yes-probability minus Kalshi yes-probability. We report distinct Polymarket snapshots, distinct co-observation days, and the calendar span, and we build uncertainty from distinct-day means with a distribution-free sign test as a robustness check, never from raw tick counts. Because the 30-minute tolerance is loose for a volatile underlying, we also record the match lag: on the one live pair the average distance between a Polymarket snapshot and its matched Kalshi snapshot is 4.4 minutes (max 23.7), and the pair's mean gap is essentially unchanged (-2.02 points) when we keep only matches inside five minutes, so the gap is not an artifact of a stale matched leg; the set-aside pairs match much looser (17.8 minutes on the $110k rung, 22.2 minutes on the single $140k point). Before characterising any pair we require a live screen on both legs (more than one distinct price with moving volume) and a coverage screen (at least five distinct co-observation days). These screens were defined after inspecting the data rather than in advance, only two of seven pairs pass them, and the single surviving p-value is not corrected for having examined seven pairs, so we treat the one live gap as a single-case observation, not a significance test. Because a persistent gap is serially correlated across days, its seven daily means are one episode rather than seven independent draws, so the day-level interval and sign test are reported as suggestive rather than conclusive. Two further limits sit on the winning pair specifically. Its Polymarket leg took only two distinct prices over the week (0.0450 and 0.0550, one 1-cent tick apart), and on three of its seven days (07-03, 07-04, 07-05) the gap sat frozen at exactly 2 points with zero intraday variation, so the roughly 2 point average gap is about two 1-cent ticks wide, is within rounding of a single 2-cent tick offset, and is not shown to exceed what tick quantization alone can produce. And because neither table carries fee, spread, depth or collateral-yield data, these screens can establish that a gap persisted but cannot test why; the "frictions explain it" story is stated as conjecture, not as a measured or falsified mechanism.
Data window. Sources are three prod tables: `prediction_market_links` (seven active pairs, created 2026-07-14), `polymarket_history` (425,244 rows since 2026-04-30) and `kalshi_history` (295,980 rows since 2026-05-30). All figures are pinned to an as-of timestamp: the most recent records were Polymarket 2026-07-15 20:38:41 UTC and Kalshi 2026-07-15 20:41:22 UTC. Both scrapers append continuously, so every number here is a moving target. Gaps use last or mid yes-probability only; neither table stores bid, ask, spread, fees, or order-book depth. Full method conventions live at /about/methodology#prediction-markets.
Limitations
- Tiny, patchy samples. Polymarket is the sparse leg on every join (1 to 212 raw snapshots per market, 1 to 8 distinct days). Five of seven pairs fail our own coverage or live-leg screens, so we report one live gap, not seven.
- One live case, not a pattern. The single gap that clears our screens rests on one contiguous week of one Bitcoin rung. Its seven daily gaps are one autocorrelated episode, so the effective independent sample is close to one, and the day-level interval and sign test overstate the evidence. Six of seven pairs are rungs of the same underlying, so there are only two question families in the whole study.
- Post-hoc screens and no multiple-testing adjustment. The live-leg and coverage screens, and the falsification rule, were chosen after we saw which pairs looked clean, and only two pairs pass, so the falsification exercise is illustrative rather than a powered test. The one surviving p-value is not corrected for having examined seven pairs.
- Coarse quotes and a two-tick gap. On the winning pair Polymarket took only two distinct prices over the week (0.0450 and 0.0550, one 1-cent tick apart), and the gap held at exactly 2 points with no intraday movement on three of the seven days. The average 2.08 point gap is about two 1-cent ticks wide and within rounding of a single tick offset, so we cannot show it exceeds what tick quantization alone produces; part of the stable gap, and possibly most of it, reflects two rounded, sticky quotes rather than continuously updating two-sided prices.
- Loose match window. Snapshots are paired within 30 minutes, which is loose for a volatile Bitcoin underlying. The one live gap is robust to this (average match lag 4.4 minutes, and the mean is unchanged inside a five-minute window), but the set-aside pairs match far looser (17.8 and 22.2 minutes), so a multi-minute stale leg could manufacture or inflate their apparent gaps, which is another reason we do not rely on them.
- No executability data. Every gap is a quoted last or mid price with no fees, spread, or depth, so we cannot show any gap was capturable after costs; the "frictions explain it" story is a conjecture, not a measured arbitrage, and our data cannot test it.
- Selection and survivorship. The links table was created 2026-07-14 and windows fall wherever the scrapers overlapped; resolved or mismatched markets never enter the sample. This is a descriptive study, not a pre-registered or out-of-sample test.
- Unresolved contracts. Nothing tracked here has settled, so we cannot say which venue is more accurate or better calibrated, only that they sometimes disagree.
FAQ
Q: Does a 2 point gap mean there was free money to be made?
No. A gap on last or mid prices is an upper bound on any real edge, and on the one live pair the gap is only about two 1-cent ticks wide to begin with. To capture it you would cross two spreads, walk two thin order books, pay fees on each leg, and lock collateral on both sides until December, in two venues that fence out each other's users. Our tables carry no fee or depth data, so we cannot show any after-cost profit, and we make no trading recommendation.
Q: Is the 2 point Bitcoin gap statistically significant?
Not in a way we would defend. The gap held across seven days, but those seven days are one persistent episode, not seven independent samples: a gap that stays put is serially correlated, so knowing one day's gap tells you most of the next day's. If you wrongly treated the seven days as independent you could quote a sign-test p of 0.0156 and an interval that excludes zero, but the honest effective sample is closer to a single week-long episode, and we also chose this pair after screening all seven. It is also only about two 1-cent ticks wide, and on three of the seven days the gap did not move at all (it sat at exactly 2 points), so part of it is tick rounding rather than a measured disagreement. We present it as one live observation of a gap that did not close over one week, not as a significance result.
Q: Why is the flashy Romania gap the weakest evidence, not the strongest?
Because its tightness comes from a Kalshi quote that never moved: one price and one volume value across roughly 500 snapshots. A gap measured against a frozen quote tells you the quote is stale, not that two active markets disagree. The $120k Bitcoin pair, where both sides actually traded, is the stronger case even though its gap is smaller.
Q: Does "Kalshi priced higher" mean Kalshi is wrong or overpriced?
No. A relative gap does not identify which venue is closer to the truth, and these contracts have not resolved yet. Judging accuracy requires resolved outcomes, which is what calibration and scoring rules measure (Wolfers and Zitzewitz, 2004). We can only say the venues sometimes disagree, not who is right.
Q: Will these gaps still be there tomorrow?
Maybe not. Every figure is pinned to 2026-07-15 and both scrapers update continuously, so the numbers move. Past patterns need not repeat; we treat these as historical statistics, not forecasts.
Sources
- Gebele and Matthes (2026), *Semantic Non-Fungibility and Violations of the Law of One Price in Prediction Markets*, arXiv 2601.01706: https://arxiv.org/abs/2601.01706
- Shleifer and Vishny (1997), *The Limits of Arbitrage*, Journal of Finance 52(1): https://onlinelibrary.wiley.com/doi/full/10.1111/j.1540-6261.1997.tb03807.x
- Maresca (2026), *Can Interest-Bearing Positions Solve the Long-Horizon Problem in Prediction Markets?*, arXiv 2602.21091: https://arxiv.org/abs/2602.21091
- Wolfers and Zitzewitz (2004), *Prediction Markets*, Journal of Economic Perspectives 18(2), NBER WP 10504: https://www.nber.org/papers/w10504
- Kalshi Fee Schedule (July 2026): https://kalshi.com/docs/kalshi-fee-schedule.pdf
- Congressional Research Service, *Prediction Markets: Policy Issues for Congress* (IF13187): https://www.congress.gov/crs-product/IF13187
- · Gebele and Matthes (2026), Semantic Non-Fungibility and Violations of the Law of One Price in Prediction Markets, arXiv 2601.01706: https://arxiv.org/abs/2601.01706
- · Shleifer and Vishny (1997), The Limits of Arbitrage, Journal of Finance 52(1): https://onlinelibrary.wiley.com/doi/full/10.1111/j.1540-6261.1997.tb03807.x
- · Maresca (2026), Can Interest-Bearing Positions Solve the Long-Horizon Problem in Prediction Markets?, arXiv 2602.21091: https://arxiv.org/abs/2602.21091
- · Wolfers and Zitzewitz (2004), Prediction Markets, Journal of Economic Perspectives 18(2), NBER WP 10504: https://www.nber.org/papers/w10504
- · Kalshi Fee Schedule (July 2026): https://kalshi.com/docs/kalshi-fee-schedule.pdf
- · Congressional Research Service, Prediction Markets: Policy Issues for Congress (IF13187): https://www.congress.gov/crs-product/IF13187
Current Polymarket and Kalshi prices, with order-book depth and the execution cost of a given size.
Free to view, no account needed.
Put this to work
Real filings, 13F flows, and positioning reads with the source on every number, in your inbox when there is something in the data, or live on Telegram. Free, no account.
No fixed schedule: it goes out when the data has something in it. Unsubscribe anytime.
Kresmion publishes information, not investment advice. See our methodology and the latest research notes.