
Explainer · Kresmion Research
What Is a Cross-Asset Market Regime Score?
A cross-asset market regime score is one standardized daily number that folds dozens of macro and market signals into a single risk-on or risk-off reading.
Instead of tracking equities, credit, rates, the dollar, volatility, and commodities one indicator at a time, the regime score combines them into one comparable number and a plain-English label. The result is a single reading that summarizes what dozens of separate market and economic signals are saying at the same moment, so you can see at a glance what kind of environment the data describes.
Key takeaways
| Metric (as of June 15, 2026) | Value |
|---|---|
| Smoothed regime score | 0.1179 |
| Raw regime score | 0.1274 |
| Regime label | Neutral |
| Conviction | 75.00% (HIGH) |
| Regime age | 47 days |
| Highest positive factor | Volatility, +0.5824 |
As of June 15, 2026, the Kresmion Macro Regime dataset shows a smoothed regime score of 0.1179, a raw score of 0.1274, and a Neutral label held at HIGH conviction of 75.00% for 47 days.
What goes into the score
The score fuses a basket of cross-asset and macro signals rather than leaning on any one indicator. Per Kresmion's methodology page, the named inputs are equity-index trend and breadth, credit spreads and high-yield OAS, rates and yield-curve shape, the dollar (DXY) trend, volatility (VIX, MOVE), commodities (gold, oil), and a net-liquidity aggregate.
Each input arrives on its own scale, so before anything is combined it is standardized. The methodology page states that every input is "z-scored against its own trailing history (~1 year), clipped to suppress extreme outliers, then combined with weights." Z-scoring means each signal is measured in standard deviations from its own recent norm, which makes a credit spread and a volatility index directly comparable. Clipping stops a single runaway reading from dominating. The exact weights and bucket boundaries are tuned internally and are not published.
The four factors
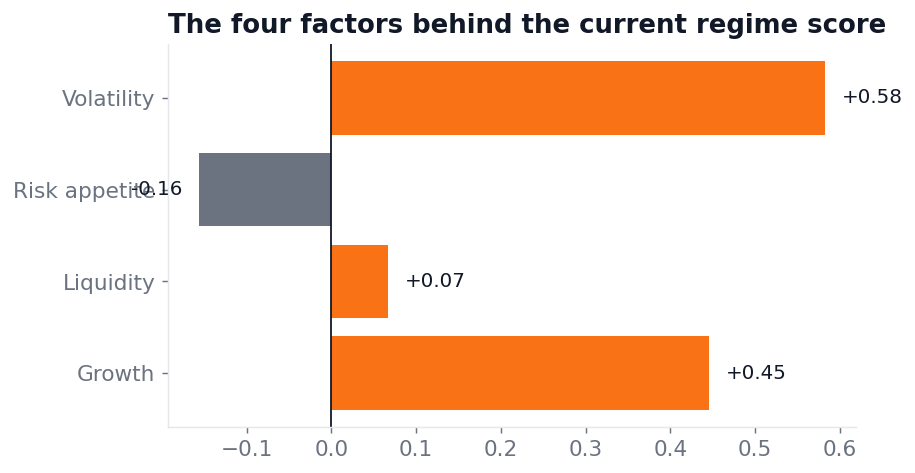
Inside the Kresmion Macro Regime dataset, the standardized inputs roll up into four headline factors stored every day: Growth, Liquidity, Risk Appetite, and Volatility, each a numeric value. As of June 15, 2026, those sub-scores were Growth +0.4460, Liquidity +0.0667, Risk Appetite -0.1559, and Volatility +0.5824.
- Growth tracks real-economy and earnings-cycle momentum. It draws on signals such as PMI, jobless claims, the economic surprise index, the copper/gold ratio, the yield curve, and equity momentum. As of June 15, 2026, the underlying components included equity momentum at -0.5769 and the yield curve at 0.0909.
- Liquidity captures financial conditions and money availability. As of June 15, 2026, its net-liquidity component was +0.4711, NFCI -0.1009, and real yield +0.5348.
- Risk Appetite measures cross-asset willingness to take risk via credit and high-yield spreads, the dollar, the AUD/JPY pair, and breakeven distance. As of June 15, 2026, the high-yield-spread component was +0.2098, DXY -0.5063, and breakeven distance -1.2947.
- Volatility captures the realized and implied volatility regime through VIX and MOVE. As of June 15, 2026, the VIX component was -0.5227 and MOVE -0.642.
The four factors do not average out to the headline number. Their simple mean is about +0.235, while the raw score is 0.1274, because the aggregation is a weighted, transformed combination rather than an arithmetic mean. The published methodology does not disclose the exact weights that produce this difference.
Reading the number: sign, buckets, and smoothing
A positive score reads risk-on, meaning a favorable cross-asset environment; a negative score reads risk-off. The scale is centered near zero and bounded by the clipping and standardization, not a 0-100 range. Across the 47 stored days from April 30 to June 15, 2026, the raw score ranged from -0.3497 to +0.4667 and the smoothed score from -0.3389 to +0.4168.
The smoothed score maps to one of five labels, per the methodology page: Strong Risk-Off, Risk-Off, Neutral, Risk-On, and Strong Risk-On, "with deliberate hysteresis around the boundaries." Hysteresis means the label resists flipping on a borderline reading, so a regime has to be clearly exceeded before it changes.
Two numbers describe the same day. The raw composite is the same-day reading; the smoothed score is an exponentially smoothed version that stops a single outlier day from flipping the regime. The lag is visible in the data: on June 13, 2026, the raw score was 0.1124 while the smoothed score was 0.0560, the smoothed value trailing the faster raw move.
Conviction and persistence
Two more fields round out the daily row. Conviction expresses how firmly the factors agree on the current label, stored as both a tier (LOW, MEDIUM, HIGH) and a percent. In the observed window the tiers were MEDIUM at 50.00% on 10 days, HIGH at 75.00% on 27 days, and HIGH at 100.00% on 10 days. The `regime_age_days` field tracks how long the current label has held, supporting the hysteresis logic; as of June 15, 2026, it stood at 47, and an `is_transition` flag marks the day a label changes.
Each row also carries a plain-language interpretation that names the leading factor and its counterweights. For June 15, 2026, it read: "The regime stays neutral with a high conviction, anchored chiefly by a strong volatility signal (+0.58) that outweighs the modest growth (+0.45) and liquidity (+0.07) factors... the lower-than-average VIX (-0.52) and weak equity momentum (-0.58) act as counterweights."
The engine recomputes on a half-hour cycle during US market hours and again at end-of-day, per the methodology page. Across the entire 47-day stored window the label has stayed Neutral, so the other four buckets and the LOW conviction tier are simply unobserved in this sample; the score range above is a sample range, not a theoretical bound.
How to read it day to day
The score is built to be glanced at, not decoded. The label answers the broad question of whether the cross-asset backdrop is leaning risk-on, risk-off, or neutral; the conviction tier tells you how unified the underlying factors are behind that label; and the four factors show which forces are pulling and which are pushing back. On June 15, 2026, that picture is a Neutral regime held with HIGH conviction, led by a strong Volatility factor and tempered by weak equity momentum, a snapshot of context rather than a signal to act on.
Frequently asked questions
What does the regime score measure?
It measures the combined state of many cross-asset and macro signals as a single standardized number. A positive value reads risk-on and a negative value reads risk-off, with the smoothed value mapped to one of five named labels.
What is the difference between the raw and smoothed score?
The raw score is the same-day composite, and the smoothed score is an exponentially smoothed version of it that prevents one outlier day from flipping the regime. On June 13, 2026, the raw score was 0.1124 versus a smoothed 0.0560, showing the smoothed value lagging the raw move.
What does conviction mean?
Conviction is how firmly the four factors agree on the current label, stored as a tier (LOW, MEDIUM, HIGH) and a percent. As of June 15, 2026, conviction was HIGH at 75.00%.
Why does the score sit near zero instead of 0 to 100?
Because each input is z-scored against its own recent history and clipped before being combined, the composite is centered near zero. Over the April 30 to June 15, 2026 window the smoothed score ranged from -0.3389 to +0.4168.
---
Prepared by Kresmion Research. This page is information, not investment advice.
- · https://kresmion.com/about/methodology
Kresmion publishes information, not investment advice. See our methodology and the latest research notes.
Kresmion is free during beta. A free account makes your watchlist permanent across devices and adds alerts when new signals fire. No card, about 30 seconds.
Start free