Research Notes
Wheat Rose 11 Percent in Six Sessions on Black Sea Strikes. A Second Supply Signal Was Firing at the Same Time, an Ocean Away.
Published by Kresmion Research. Read our editorial approach and data methodology.
By Kresmion Research, July 17, 2026
Chicago wheat futures closed at 611.25 cents per bushel on July 9. By Friday morning, July 17, the contract traded at 677.50 cents, about 6.78 dollars per bushel, a rise of roughly 10.8 percent in six sessions, with one session in the middle of the week up more than 7 percent on its own. The driver on every wire is the Black Sea: Ukrainian drone boats disabled two Russian tankers, Russia struck port infrastructure around Odesa in response, and traffic through the region's export corridors thinned.
That part of the story is visible to everyone. What Kresmion's monitoring added this week is a second, quieter supply signal from the opposite side of the planet. A modeled crop water stress gauge covering Australia's wheat belt more than doubled in four days, its largest proportional four-day rise in the gauge's ten-week record, reaching its highest level since the end of May and firing critical-severity anomalies on consecutive days. That makes Australia the second wheat region to trip the layer's highest severity this season, after Ukraine's Black Sea belt in late May. Australia is one of the handful of exporters the world leans on when Black Sea supply is in doubt. This note lays out both signals, what connects them, and the considerable list of reasons the connection could dissolve. It is a description of what happened, not a forecast and not advice.
The move everyone can see
The visible driver is the war reaching the grain trade's shipping lanes. On July 16, Ukrainian uncrewed surface vessels struck and disabled two Russian shadow-fleet tankers in the eastern Black Sea, an event that appeared in Kresmion's OSINT stream at 11:08 UTC, within hours of open reporting, and fed a Ukraine regional convergence signal our engine raised that afternoon. Russia retaliated with strikes on port locations around Odesa. Trade coverage the same day reported Russian wheat exports could run 13 to 20 percent lower in July, with Sea of Azov shipping already restricted.
The tape's response, from Kresmion's price and volume monitors, verified against exchange data on Friday morning:
| Session | ZW=F close (cents per bushel) | Move |
|---|---|---|
| July 9 | 611.25 | starting point |
| July 10 | 632.00 | +3.4 percent |
| July 13 | 627.00 | -0.8 percent |
| July 14 | 631.25 | +0.7 percent |
| July 15 | 677.50 | +7.3 percent |
| July 16 | 674.75 | -0.4 percent |
| July 17, morning | 677.50 | holding the move |
Volume confirmed the participation: in the run-up to the jump, Kresmion's volume anomaly detector flagged a session of roughly 87,200 contracts, about three times the 20-day average (detected July 14). A move of this size arriving on heavy participation is a market repricing supply risk.
Europe added its own pressure in the background. French soft wheat rated good to excellent fell to 65 percent this week, down from 77 percent a month earlier, a reminder that the Northern Hemisphere harvest arriving now is not uniformly comfortable either.
The signal almost nobody is pricing
Kresmion runs a physical-data layer that monitors 17 agricultural and industrial regions daily. For crop regions, it computes a water stress index from modeled weather and soil data (the underlying feed is Open-Meteo climate data, aggregated over each region). The layer is young, with about ten weeks of history, and we treat it accordingly. But what it did this week is worth reporting.
The index for the Australian wheat belt read 4.68 on July 12. Four days later, on July 16, it read 11.37, having more than doubled, with the sharpest jumps on July 14 and 15. Against its trailing baseline near 5.5, the July 15 reading registered 3.9 standard deviations high, and the layer fired critical-severity anomalies on consecutive days, the third and fourth critical crop readings in its history. The two earlier ones were Colombian coffee country on May 10 and Ukraine's Black Sea wheat belt on May 23, which makes Australia the second wheat region to reach the layer's highest severity this season. Seven anomalies of any kind fired across all 17 monitored regions in the past week; the two Australian readings are the only critical crop events among them.
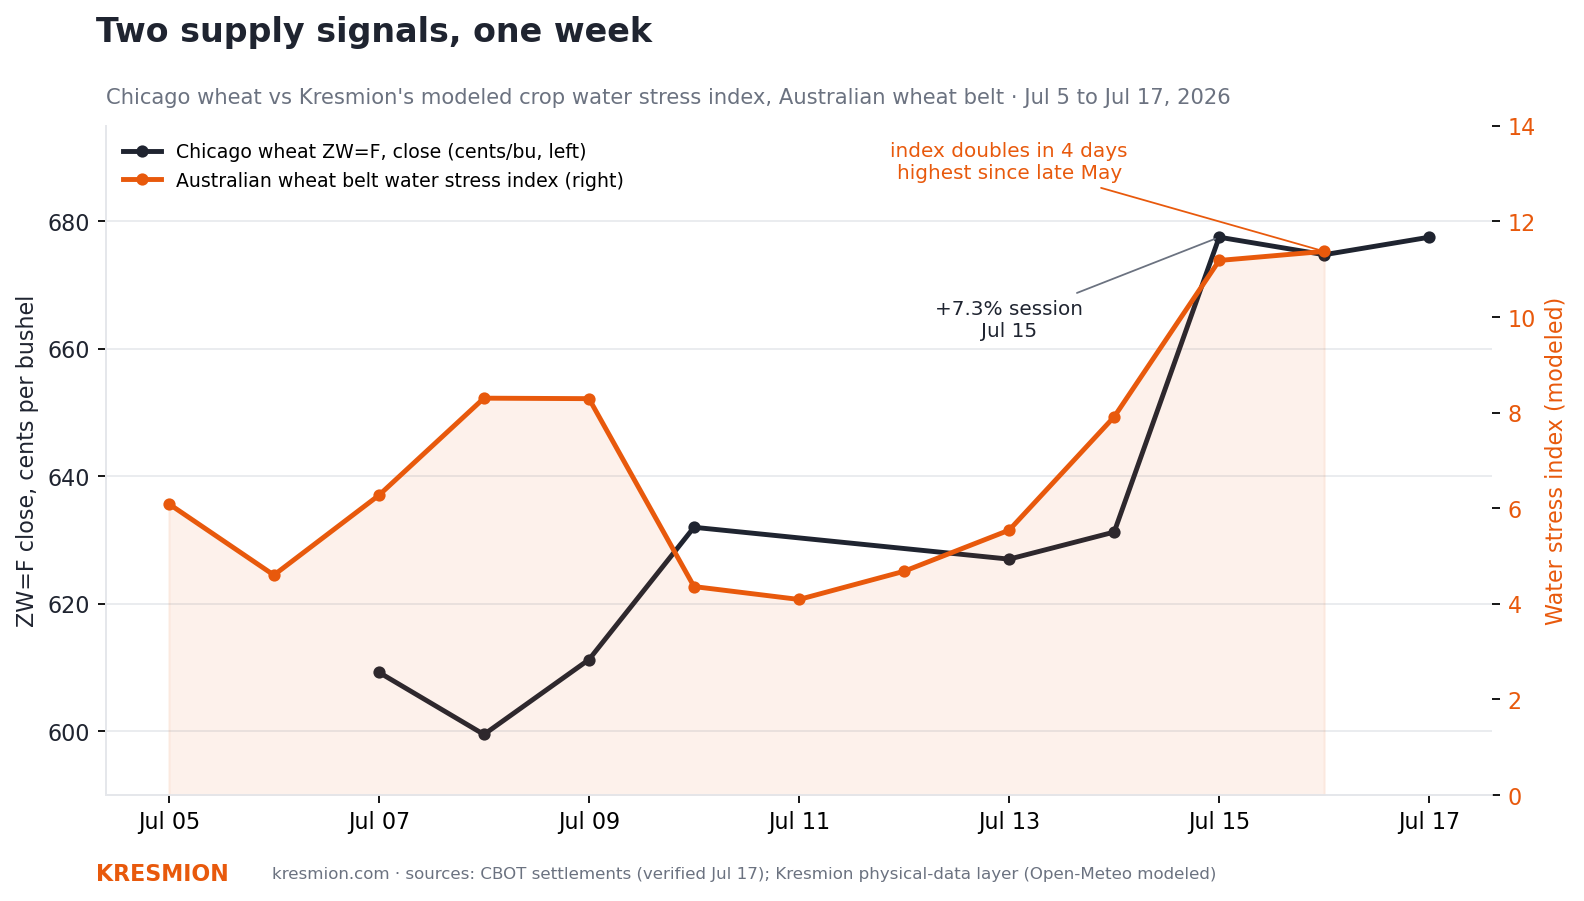
ZW=F daily closes (left axis, cents per bushel) against Kresmion's modeled water stress index for the Australian wheat belt (right axis), July 5 to July 17, 2026. Sources: CBOT settlement data verified via exchange feed July 17; Kresmion satellite_observations, region 9.
Two honest qualifications belong next to that number. First, the absolute level is not a series record: the index ran between 14 and 16 in mid-May, during the dry Australian autumn that was already making news, and this week's readings are the highest since May 27. What is new is the speed of the round trip, from a comfortable 4 to 5 range back above 11 in four days, the largest proportional four-day rise in the series. The series itself supplies a caution here: it produced a similar proportional doubling in mid-June from a much lower base, and that one faded within days. Fast rises from low levels can be noise; this one is distinguished by where it landed. Second, ten weeks of history is a short baseline, and a 3.9 sigma reading against a short baseline is a strong prompt to look closer, not a statistical verdict.
The context that makes the gauge worth watching is what the May stress episode preceded. Australia's official forecaster ABARES now projects 2026-27 wheat production down 26 percent year on year, at 26.7 million tonnes, 23 percent below the five-year average, with national planted area down 12 percent, after exactly that dry start. Rain through late May and June repaired sentiment, and our index eased in step, drifting between 4 and 9 through late June and early July. This week it snapped back. The seasonal outlook leans the wrong way as well: forecasters put a 60 to 80 percent chance on below-average rainfall across the cropping regions this winter, with El Nino conditions a live risk. And the crop's most sensitive window, the September to November spring period our monitoring flags as the region's critical months, is still ahead. An early-season stress signal cuts both ways: there is time for rain to repair it, and time for it to compound.
The market, for now, is pricing almost none of this through the Australian channel. Australian cash wheat rose only modestly this week; local coverage attributes the muted response to heavy carryover stocks and export competition. The week's advance belongs to the Black Sea. The Australian gauge is a signal about the size of the world's cushion if the Black Sea disruption persists into the Southern Hemisphere spring.
The fuel underneath the move
There is a third ingredient that says something about how the move happened, separate from why. Speculators came into this week heavily short Chicago wheat. As of the July 7 CFTC Commitments of Traders report, released July 10, managed money held 73,719 long contracts against 134,151 shorts in SRW wheat, a net short of roughly 60,400 contracts. Wheat has been one of the most persistently shorted contracts in agriculture, and a market structured that way amplifies supply shocks: shorts covering into a rising tape add buying that has nothing to do with fresh conviction about wheat itself. The mirror image showed up in energy off the same report: in natural gas, speculators were holding one of their most crowded long positions in a year, and the price fell nearly 11 percent anyway.
The nuance in the same report is that Kansas City hard red winter wheat told the opposite story, with managed money slightly net long, 63,305 longs against 54,576 shorts. The short base was concentrated in the Chicago contract, which is the contract that jumped 7 percent in a session. That is consistent with a covering component in the move, and tonight's COT report, covering the week through July 14 and released at 19:30 UTC, will show how much of the short book actually came in before the biggest session of the week.
The strongest evidence against this read
The case against treating this week as a durable supply story is substantial, and parts of it are already in the price action.
The war premium can leave as fast as it arrived. The move is concentrated in two sessions tied to specific strikes, and export-corridor disruptions in this war have repeatedly been priced as permanent and resolved as temporary. If tanker traffic and Odesa port flows normalize over the next two weeks, the largest component of the advance deflates with them.
Australia's cushion is real. The reason Australian cash prices barely moved is that the country is sitting on heavy old-crop stocks after strong prior seasons, and exporters are competing for demand. A stressed new crop matters most in a world with thin stocks; Australia's are not thin. The stress gauge speaks to the 2026-27 harvest, which is months from delivery.
The gauge itself is unproven. Ten weeks of history, modeled rather than ground-truth data, and a reading that is high against its recent baseline but below its May peak. Its one prior critical wheat call, Ukraine's belt in late May, has had no crop outcome to validate against yet, and a war interrupting exports is not a harvest result. We report this week's signal because watching these regions is what the layer exists to do. It has no track record yet.
And part of the buying was mechanical. A 60,000-contract net short unwinding into a headline shock produces price movement regardless of what any trader believes about wheat supply. Some fraction of the 7.3 percent session is that unwinding, and that fraction carries no information about crops.
What would change the read
Four observable things, in rough order of speed. Tonight's COT report shows the July 14 positioning: a large drop in the SRW short book would confirm the covering component and mark the remaining fuel as mostly spent. Black Sea shipping data over the next two weeks either shows corridor traffic recovering, which unwinds the risk premium, or shows the July export shortfall hardening toward the 13 to 20 percent figures now being reported. The Australian index either mean-reverts the way it did after its brief early-July uptick, which would retire this week's anomaly as noise, or holds above its baseline into August, which would put the winter dryness scenario on track ahead of the September to November window. And ABARES publishes its next crop report in early September; a second cut to the 26.7 million tonne forecast would move the Australian channel from a modeled signal to an official one.
Elsewhere on the tape
- Dealer gamma went uniformly negative into Friday. QQQ closed July 16 with modeled net dealer gamma at minus 6.14 billion dollars, the most negative reading since the model's tracking began in late June, with spot at 705.94 against a zero-gamma level of 719.33. SPY flipped back negative at minus 3.45 billion dollars and IWM held negative at minus 1.46 billion, leaving all three tracked index complexes below their flip levels simultaneously, per Kresmion options positioning estimates. Dealer hedging in that configuration amplifies moves in both directions.
- Bitcoin ETF flows put together a third straight inflow day. After the 478.1 million dollar outflow on July 13, US spot bitcoin funds took in 167.1, 97.7 and 79.1 million dollars across July 14 to 16, per Kresmion ETF flow data, a 343.9 million dollar three-day run in a trailing month that averaged a 128 million dollar daily outflow even counting the inflow days.
- Prediction markets priced the Iran diplomatic track calmer while the physical escalation continued. Polymarket's contract on Iran announcing a withdrawal from MOU negotiations by July 31 fell from about 36 percent earlier in the week to 12.5 percent, quoted live from the venue API at 11:43 UTC on July 17 on about 2.1 million dollars of volume, even as strikes around the Strait of Hormuz kept energy-linked OSINT signals firing in Kresmion's monitoring.
Key takeaways
| Point | Detail |
|---|---|
| The move | Chicago wheat rose about 10.8 percent in six sessions, from 611.25 to 677.50 cents per bushel, with a 7.3 percent single session on July 15 and a three-times-average volume session flagged in the run-up |
| The visible driver | Black Sea escalation: disabled tankers, strikes around Odesa, restricted Sea of Azov shipping, and reports of Russian July exports running 13 to 20 percent lower |
| The quiet signal | Kresmion's modeled water stress index for the Australian wheat belt more than doubled in four days, its largest proportional four-day rise on record, to its highest level since May 27, firing critical anomalies on consecutive days |
| The context | ABARES already forecasts the Australian crop down 26 percent year on year after a dry autumn; the seasonal outlook leans dry; the crop's most sensitive months are still ahead |
| The fuel | Managed money was net short roughly 60,400 SRW contracts going into the week, so short covering likely amplified the move; tonight's CFTC report is the check |
| The caveats | The stress layer has ten weeks of history; the index level is below its May peak; Australian stocks are heavy; war premiums retrace fast |
Frequently asked questions
What is the crop water stress index and where does the data come from?
It is a daily index Kresmion computes for 17 monitored agricultural and industrial regions worldwide, derived from modeled weather and soil data supplied by the Open-Meteo climate feed, aggregated over each region. Higher readings indicate drier, more stressed growing conditions. The layer came online in early May 2026, so its history is about ten weeks deep, which is why this note treats its readings as a prompt for attention rather than a statistical verdict.
Why did wheat prices jump this week?
The proximate driver was Black Sea escalation. Ukrainian drone boats disabled two Russian tankers on July 16, Russia struck port infrastructure around Odesa, Sea of Azov shipping was already restricted, and trade coverage reported Russian July wheat exports could run 13 to 20 percent lower. Chicago wheat rose about 10.8 percent over six sessions, with a 7.3 percent jump in the July 15 session and a session of roughly three times average volume flagged in the run-up.
Does the Australian signal mean the crop is failing?
No. The index is high against its recent baseline but below the levels it reached in mid-May, Australia holds heavy old-crop stocks, and the crop's most sensitive spring window is still months away, leaving time for rain to repair conditions. What the signal marks is speed and level together: the largest proportional four-day rise in the layer's record, to the highest reading since May 27, on a crop the official forecaster already projects down 26 percent year on year, into a seasonal outlook that leans dry.
What is the single most important caveat?
That the two supply channels are independent and could resolve independently. The Black Sea premium can deflate in days if shipping normalizes, and the Australian gauge could mean-revert with one rain system. The week is notable because both channels tightened at once into a heavily shorted market; it stops being notable if either reverses.
Sources
Kresmion physical-data monitoring (satellite_observations, satellite_anomalies, region 9, Australian Wheat Belt): water stress index daily readings May 9 to July 16, 2026, including 4.68 on July 12, 5.54 on July 13, 7.91 on July 14, 11.18 on July 15 and 11.37 on July 16; trailing baseline mean near 5.5 at trigger; anomaly severity CRITICAL fired July 16 and July 17 at 07:00 UTC (z-scores 3.9 and 3.1), the third and fourth critical crop anomalies in the table after Colombia Huila (May 10) and Ukraine Black Sea Belt (May 23); series statistics: 66 observations, full-series mean 7.45, maximum 15.79 on May 12, 2026, highest reading since May 27 as of July 16.
Kresmion price and volume monitors (intelligence_events, asset_signals, ZW=F): gap and volume detections July 10 to July 16, including roughly 87,200 contracts traded July 14, about three times the 20-day average. Daily settlement path verified against exchange data via Yahoo Finance on July 17, 2026, 11:28 UTC: closes of 611.25 (July 9), 632.00 (July 10), 627.00 (July 13), 631.25 (July 14), 677.50 (July 15), 674.75 (July 16) and 677.50 quoted the morning of July 17.
Kresmion OSINT stream and convergence engine (osint_events, compound_signals id 211): a Ukraine-region convergence cluster grouped July 16, 2026, whose load-bearing event is the disabling of two Russian shadow-fleet tankers by Ukrainian uncrewed surface vessels, first sourced from open reporting at 11:08 UTC.
CFTC Commitments of Traders, report week July 7, 2026, released July 10: SRW wheat managed money 73,719 long versus 134,151 short; HRW wheat managed money 63,305 long versus 54,576 short. Via IndexBox summary: https://www.indexbox.io/blog/cot-report-july-10-2026-speculative-and-commercial-positioning-in-futures-markets/
Black Sea escalation and export impact: Bloomberg, "Wheat Holds Near Two-Month High After Black Sea Attacks," July 16, 2026, https://www.bloomberg.com/news/articles/2026-07-16/wheat-holds-near-two-month-high-after-black-sea-attacks ; AgWeb, "Wheat Skyrockets as Black Sea Exports Threatened," https://www.agweb.com/markets/market-analysis/wheat-skyrockets-black-sea-exports-threatened-pulling-corn-and-soybeans ; Brownfield Ag News, "Wheat rises, watching global trade, weather," https://www.brownfieldagnews.com/market-news/wheat-rises-watching-global-trade-weather/ ; Farm Weekly, "Black Sea: Ukrainian attacks spark global wheat price surge," https://www.farmweekly.com.au/story/9310362/black-sea-ukrainian-attacks-spark-global-wheat-price-surge/
Australian crop outlook: ABARES Australian Crop Report, June 2026, wheat production forecast 26.7 million tonnes, down 26 percent year on year, national wheat area down 12 percent, https://www.agriculture.gov.au/abares/research-topics/agricultural-outlook/australian-crop-report/june-2026 ; World Grain, "Australia's 2026-27 winter crop seen slipping," https://www.world-grain.com/articles/22822-australias-2026-27-winter-crop-seen-slipping ; Rabobank Australia winter crop outlook, https://www.rabobank.com.au/news/media-releases/2026/australia-looks-to-smaller-winter-crop--impacted-by-mixed-weathe
Kresmion options positioning estimates (options_gamma_exposure, July 16, 2026 end of day, modeled): QQQ net gamma minus 6.14 billion dollars, spot 705.94, zero-gamma 719.33; SPY minus 3.45 billion, spot 750.72, zero-gamma 752.53; IWM minus 1.46 billion, spot 295.59, zero-gamma 299.10.
Kresmion ETF flow data (crypto_etf_aggregate): US spot bitcoin ETF net flows, minus 478.1 million dollars July 13, plus 167.1 million July 14, plus 97.7 million July 15, plus 79.1 million July 16, 2026.
Kresmion prediction-market monitor (polymarket_markets id 2643400), Iran MOU withdrawal by July 31 contract, re-checked against the live Polymarket API July 17, 2026.
- · Kresmion physical-data monitoring (satellite_observations/satellite_anomalies, AOI 9 Australian Wheat Belt): water stress index 4.68 (Jul 12) to 11.37 (Jul 16), highest since May 27; CRITICAL anomalies fired Jul 16-17 (z 3.9, 3.1), the 3rd and 4th critical crop anomalies after Colombia (May 10) and Ukraine wheat belt (May 23); series since May 9, full-series mean 7.45, max 15.79 (May 12).
- · Kresmion price/volume monitors (intelligence_events, ZW=F) + exchange data verified via Yahoo Finance Jul 17 11:28 UTC: closes 611.25 (Jul 9) to 677.50 (Jul 17 morning), +7.3 percent session Jul 15, ~87,200 contracts Jul 14 (~3x 20-day average).
- · Kresmion OSINT stream (compound_signals id 211, osint_events): Ukraine-region convergence cluster grouped Jul 16; load-bearing event = two Russian shadow-fleet tankers disabled by Ukrainian USVs (11:08 UTC).
- · CFTC Commitments of Traders, week of Jul 7 2026 (released Jul 10): SRW wheat managed money 73,719 long vs 134,151 short; HRW 63,305 long vs 54,576 short. Via IndexBox: https://www.indexbox.io/blog/cot-report-july-10-2026-speculative-and-commercial-positioning-in-futures-markets/
- · Bloomberg, Wheat Holds Near Two-Month High After Black Sea Attacks (Jul 16, 2026): https://www.bloomberg.com/news/articles/2026-07-16/wheat-holds-near-two-month-high-after-black-sea-attacks
- · AgWeb, Wheat Skyrockets as Black Sea Exports Threatened: https://www.agweb.com/markets/market-analysis/wheat-skyrockets-black-sea-exports-threatened-pulling-corn-and-soybeans
- · Farm Weekly, Black Sea: Ukrainian attacks spark global wheat price surge: https://www.farmweekly.com.au/story/9310362/black-sea-ukrainian-attacks-spark-global-wheat-price-surge/
- · ABARES Australian Crop Report, June 2026 (wheat 26.7 Mt, -26 percent; area -22 percent): https://www.agriculture.gov.au/abares/research-topics/agricultural-outlook/australian-crop-report/june-2026
- · Kresmion options positioning estimates (options_gamma_exposure, Jul 16 EOD): QQQ -6.14B, SPY -3.45B, IWM -1.46B net dealer gamma, all below zero-gamma levels.
- · Kresmion ETF flow data (crypto_etf_aggregate): BTC spot ETF net flows Jul 13-16: -478.1M, +167.1M, +97.7M, +79.1M dollars.
- · Polymarket live API, market 2643400 (Iran MOU withdrawal by Jul 31): 12.5 percent, fetched Jul 17 2026 11:43 UTC, ~2.1M dollars volume.
Get the smart money brief
The same insider, 13F, and positioning reads you just read, in your inbox when there is something in the data, or live on Telegram. Free, no account.
No fixed schedule: it goes out when the data has something in it. Unsubscribe anytime.
Kresmion publishes information, not investment advice. See our methodology and the latest financial news.