By Kresmion Research, October 13, 2026
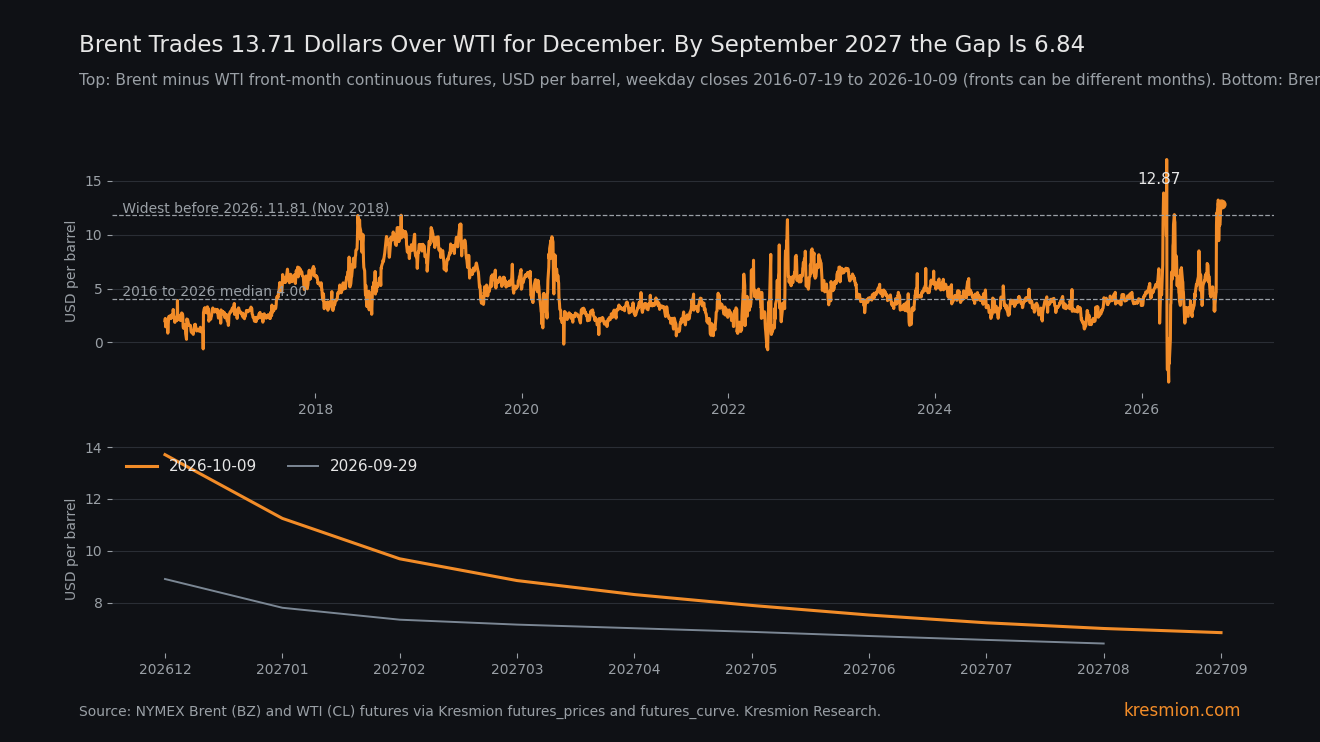
Brent for December delivery costs 13.71 dollars more than WTI for the same month on October 9, and the curve prices about half that gap by September 2027. On September 29 the December against December gap was 8.91. It reached 11.47 on October 1, with Brent December up 6.15 and WTI December up 3.59 over two sessions that spanned the expiry of the Brent November contract. The data do not show whether the expiry affected December prices. After that the gap rose to 12.82 on October 2, eased to 12.12 on October 5 and closed at 13.71 on October 9, with Brent December up 2.41 and WTI December up 0.17 from October 1. The January gap rose from 7.80 to 11.25 and March from 7.15 to 8.85. Benzinga and an analyst quoted by Rigzone point to shipping costs, and the tanker-rate figures come from one secondary source. The price data cannot separate freight from a Brent-specific supply risk premium.
Key takeaways
| What | Number |
|---|---|
| Like-for-like spread, December 2026 contracts, October 9 | Brent 104.72 minus WTI 91.01 = 13.71 dollars, up from 11.47 on October 1 and 8.91 on September 29 (Kresmion futures_curve) |
| December contracts, two windows | Brent +8.56 dollars from September 29 (96.16 to 104.72) and WTI +3.76 (87.25 to 91.01); from October 1 Brent +2.41 and WTI +0.17. Brent moved more than WTI in both windows (futures_curve) |
| Shape of the gap, October 9 (September 29 in brackets) | December 13.71 (8.91), January 2027 11.25 (7.80), March 8.85 (7.15), June 7.52 (6.71), September 2027 6.84 (futures_curve) |
| Continuous front-month spread, October 9 | 12.87 dollars, Brent December against WTI November. Matched or exceeded on 7 of 2,572 weekday closes since July 19, 2016, all in 2026, three of them in the last two sessions of an expiring Brent contract. Median 4.00. Widest before 2026: 11.81 on November 1, 2018 (futures_prices) |
| US refiner margin | WTI-based 3-2-1 crack 66.75 dollars against 53.88 on Brent. The 12.87 crude discount (mixed contract months) is about 19% of the WTI figure (futures_prices) |
| Stocks, September 30 to October 9 | MPC +15.1%, VLO +11.9%, PSX +9.0%, XOM +3.8%, XLE +5.8%, S&P 500 +2.1% (company_price_snapshots, correlation_close_history) |
| Speculators in WTI futures | Net long cut from 141,106 contracts (September 22) to 99,060 (October 6), down 29.8%, back to about the August 11 level of 99,196. WTI November moved from 90.52 to 89.44 over the same dates (CFTC via Kresmion cot_reports, futures_curve) |
What the data shows
Brent prices crude delivered by ship, WTI prices crude in Cushing, Oklahoma. Over ten years the front-month gap had a median of 4.00 dollars (2,572 weekday closes, July 19, 2016 to October 9, 2026).
The continuous Brent series now sits on December and the continuous WTI series on November, so Kresmion compared contracts for the same month. December Brent closed at 104.72 and December WTI at 91.01 on October 9, a gap of 13.71. Benzinga, which does not name the exchange, put the December gap at 13.85 on Monday morning, against 7.08 on September 21 and 4.02 on July 2 (contract months not stated), and reports the same December spread widening from 11.47 to 13.71 in October (Benzinga). Our contracts are the NYMEX Brent look-alike, so small differences are expected.
The December gap rose from 8.91 on September 29 to 11.47 on October 1 and 13.71 on October 9. The first step came with Brent December up 6.15 and WTI December up 3.59 over two sessions that spanned the expiry of the Brent November contract. The data do not show whether the expiry affected December prices. The 2.24 added from October 1 to October 9 came after the expiry: December Brent rose 2.41 and December WTI 0.17.
The gap also reaches further out than it did. By contract month on October 9 the Brent premium was 13.71 for December, 11.25 for January, 9.69 for February, 8.85 for March, 7.52 for June and 6.84 for September 2027. On September 29 January was 7.80, March 7.15 and June 6.71. Brent is steeply backwardated, meaning near contracts cost more: 104.72 for December against 87.18 for September 2027. WTI falls 10.67 over the same stretch.
Live front-month quotes at 05:42 UTC on October 13: Brent 105.39, WTI 92.48 (different contract months). Monday's closes were 106.65 and 93.74.
The mechanism
In normal times the gap is capped by arbitrage. A trader buys WTI, pipes it to the Gulf Coast and ships it to Europe or Asia, and the gap settles near the cost of doing that. Art Hogan of B. Riley Wealth told Rigzone that Brent, priced on waterborne delivery, absorbs shipping premiums, and put the spread at about 13 dollars on September 30, an expiring-contract day (Rigzone). Benzinga cites Baltic Exchange data putting US Gulf to Rotterdam tanker earnings near 308,200 dollars a day last week (Benzinga, October 12), against 79,600 before the war, and reports Goldman Sachs citing elevated US to Europe shipping costs. When shipping costs jump, the band widens and US barrels do not leave fast enough to pull WTI up toward Brent.
Two facts in our data fit this. December Brent rose 8.56 dollars from September 29 while December WTI rose 3.76, and from October 1 the moves were 2.41 and 0.17, so Brent moved more than WTI in both windows. And the gap by month falls from 13.71 for December to 6.84 for September 2027, a shape consistent with a prompt shipping or supply shock. The January and March gaps have risen since September 29, so the curve now prices the gap to last longer than it did two weeks ago. Whether that is freight or supply risk the price data cannot say.
The second-order effect runs through refiners, which buy crude at WTI-linked prices and sell products at global prices. On October 9 the WTI-based 3-2-1 crack (a paper margin: two parts gasoline and one part heating oil against three barrels of crude) was 66.75 dollars, against 53.88 on Brent. The 12.87 crude discount, on fronts that mix contract months, is about 19% of the WTI figure. The rest is product margin, itself high: the Brent-based crack was matched or exceeded on only 90 of 2,572 days.
MPC rose 15.1% and VLO 11.9% from September 30 to October 9, against 2.1% for the S&P 500, 5.8% for the XLE energy fund and 3.8% for XOM, so part of the move is sector-wide. MPC's seven-session gain was matched or exceeded in 40 of 2,458 overlapping seven-session windows since December 2016, VLO's in 86 (company_price_snapshots; windows overlap, so they are not independent). The equity moves do not show what caused the spread.
Speculators cut WTI net length by 42,046 contracts, 29.8%, between September 22 and October 6, while the WTI November contract moved only from 90.52 to 89.44. The cut starts from a local high: 99,060 is about where net length stood on August 11 (99,196), and it was 62,683 on July 14. The continuous WTI series fell from 94.59, but that crosses the September 23 roll. Our Brent December curve starts on September 29, so no like-for-like Brent comparison exists for the window. The positioning data does not show why speculators cut, and it is not evidence about the spread.
Other explanations
Month mismatch. The continuous spread jumped from 4.66 to 10.92 on September 23, when the WTI front rolled, and fell from 13.11 to 9.44 on October 1, when the Brent front rolled to December. Matched months avoid this: December against December was 13.71 on October 9, against 11.47 on October 1, so the current level is not a mixing artifact. The ten-year continuous history is contaminated by an unknown amount.
US-side weakness. A feared US diesel export ban could cut refinery runs (more than 2 million barrels a day, a Wood Mackenzie estimate via Benzinga), and a 922,000-barrel rise in US inventories, cited by Naeem Aslam in Rigzone (product not specified), can weigh on WTI. Benzinga says expectations of a ban have since faded. December WTI rose 3.76 from September 29 (87.25 to 91.01) but only 0.17 from October 1, while December Brent rose 8.56 and 2.41. That fits a strong Brent side and does not rule out WTI weakness, in an unknown share.
A Brent supply risk premium. Rigzone quotes Naeem Aslam that tanker risks persist around the Strait of Hormuz and that supply buffers are small. Benzinga says tanker rates surged after the war with Iran disrupted shipping routes. Supply risk and freight both lift waterborne Brent. The price data cannot split them, and the size of each is unknown.
The base rate
Over 2,572 weekday closes of the continuous front spread, the October 9 close of 12.87 was matched or exceeded on 7 days, all in 2026: March 20, 26, 27 and 31, September 29 and 30, and October 9. September 29 and 30 were the last two days of the Brent November contract, and March 31 was the last session before the Brent front rolled on April 1, so those three prints may overstate. Before 2026 the widest close was 11.81 on November 1, 2018. In 2018, 28 weekday closes were at 10 or more. Hogan told Rigzone the spread historically runs 8 to 10 dollars. Our 2016 to 2026 front-month median is 4.00, so his range does not match this data.
The like-for-like December spread has nine sessions of history, because the Brent December contract in our data starts on September 29. No percentile is claimed for it. For the same reason we have no history for deferred-month gaps, so where 6.84 for September 2027 sits in its own distribution is unknown; it is a different tenor from the 4.00 front-month median.
WTI speculator net length is 5.24% of open interest (1,889,422 contracts), at or below that on 26 of 327 weeks since July 2020 (median 13.97%); the low in that window was 1.99% on October 21, 2025. Open interest rose from 1,841,811 over the two weeks, so the cut did not come with falling open interest.
By an editorial count of the desk logs (not a query result), about 200 series were scanned across five desks, so a 99th percentile reading in one or two would turn up by chance. The claim rests on the matched-month level, its widening after the Brent November expiry and the curve shape. The curve, fronts, cracks and live quotes are one vendor feed. CFTC data is a separate filing. The tanker-rate figures come from one secondary source (Benzinga citing the Baltic Exchange).
The evidence against
This year's own history is the strongest counter. The continuous spread reached 16.97 on March 31, was below zero on April 2 (minus 2.51) and was minus 3.68 on April 7. That path crossed a Brent roll (front 118.35 on March 31, 101.16 on April 1), so it mixes reversion with a change of contract month in unknown shares. The October 1 drop from 13.11 to 9.44 was a roll: December against December was 11.47 that day.
September 2027 is priced at 6.84, about half of December's 13.71. Goldman Sachs, per Benzinga, projects Brent at 90 and WTI at 81 in December, a gap of 9. Phil Flynn of PRICE Futures Group argued in the same Rigzone piece that diesel, not crude, is the bottleneck, and that the spread had come in from 13 to 14 dollars toward 7; Rigzone does not say which contracts he measured, and the prompt prints near 13 that week sat on the expiring Brent November contract. Our crack data fits his diesel point in part: the Brent-based crack alone is high, so refiner gains do not need the WTI discount. On October 9 no contract was expiring.
What would change the read
- The December against December spread closes below 11.47 dollars, its level on October 1, the first session after the Brent November expiry, before the NYMEX Brent December contract stops trading at the end of October. That would mean the post-expiry widening has reversed. A prompt gap that stays above 12 after Brent rolls to January (January against January was 11.25 on October 9) would mean it persists.
- Baltic Exchange US Gulf to Rotterdam tanker earnings fall toward the pre-war 79,600 dollars a day without the spread narrowing. That would undercut the freight mechanism.
- A jump in the weekly EIA crude export figure or Kpler's September exports would be the arbitrage working.
- The CFTC report for October 13, due Friday October 16. WTI speculator net length was 99,060 contracts on October 6.
Frequently asked questions
Why is Brent 13.71 dollars above WTI?
For December delivery, Brent closed at 104.72 and WTI at 91.01 on October 9. Brent prices waterborne oil, so shipping costs and supply risk feed into it. One secondary source (Benzinga citing the Baltic Exchange) points to tanker earnings near 308,200 dollars a day. The price data cannot separate that from a Brent supply risk premium.
Did the gap just widen?
Yes. December against December went from 8.91 on September 29 to 11.47 on October 1 and 13.71 on October 9. Part of the first step spans the Brent November expiry; whether the expiry affected December prices is unknown. The prompt gap, which mixes contract months, was 13.21 and 13.11 on September 29 and 30 (expiring Brent November), 9.44 on October 1 and 12.87 on October 9. January went from 7.80 to 11.25.
Is this a record gap?
No. The 12.87 front-month close was matched or exceeded on 7 of 2,572 days since July 2016, all in 2026, and the widest was 16.97 on March 31, which fell below zero within days on a path that crossed a contract roll. The like-for-like December spread has only nine sessions of history.
Why don't traders ship cheap US crude abroad until the gap closes?
Some do: Kpler, via Benzinga, put US crude shipments at 3.72 million barrels a day in August, 45,000 above July. The mechanism offered is that high tanker rates widen the gap that shipping can close. The tanker-rate figures come from one secondary source (Benzinga citing the Baltic Exchange), and August is the latest Kpler export figure cited, so it does not show what happened in the last two weeks of widening.
What does the gap mean for US refiners?
A US refiner buys at WTI-linked prices and sells at global product prices. The 12.87 crude discount, on mixed contract months, is about 19% of the 66.75 dollar WTI-based 3-2-1 crack, and the rest is product margin. The curve prices the gap at 6.84 by September 2027.
When is the next data point?
September CPI comes Wednesday October 14, and the CFTC report for October 13 comes Friday October 16.
Sources
Kresmion commodities dashboard: futures_prices, futures_curve and commodity_prices queries for Brent, WTI, crack spreads and live quotes, read October 13, 2026.
Benzinga, October 12, 2026: Monday December gap of 13.85, the December spread from 11.47 to 13.71, Baltic Exchange tanker earnings and Kpler exports (secondary), Goldman Sachs on shipping costs and its December forecast, Iran war and shipping routes.
Rigzone, October 1, 2026: Art Hogan on waterborne pricing, Phil Flynn's dissent on diesel, Naeem Aslam on Hormuz tanker risk and the 922,000-barrel US inventory build.
Schwab, October 12, 2026: CPI and earnings calendar, bond market closed Monday.
Continuum Economics, preview of September CPI: headline and core forecasts, energy +5.5%.
CFTC, Commitments of Traders: WTI non-commercial positions, contract 067651, report date October 6, 2026. Data via Kresmion's cot_reports and the cftc_history tool; the page itself was not fetched.