By Kresmion Research, October 19, 2026
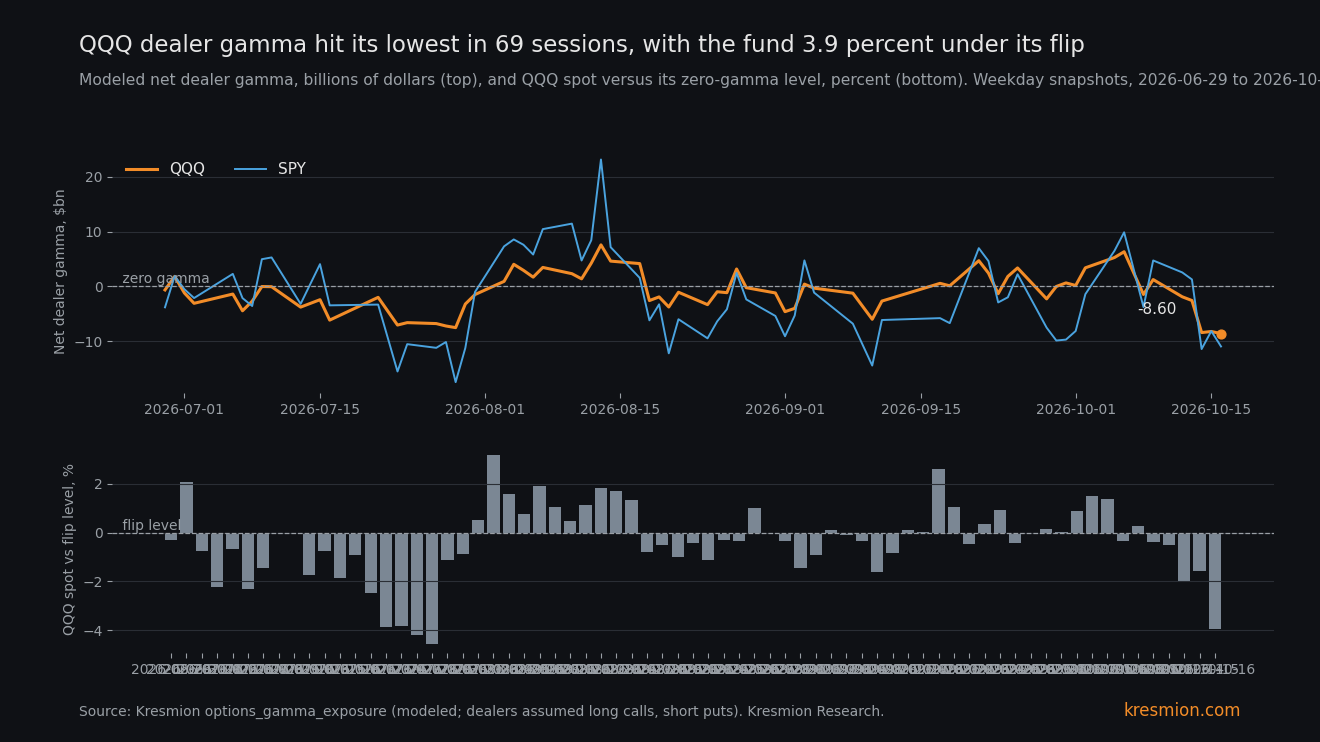
QQQ's modeled dealer gamma closed Friday at minus 8.60 billion dollars, the lowest of 69 weekday snapshots, with the fund 3.93 percent below its flip level. Kresmion holds weekday snapshots from June 29 to October 16. On the 9 earlier days when QQQ gamma was below minus 5 billion dollars, the next day's move averaged 1.40 percent in either direction. After the 26 positive readings it averaged 0.89 percent. The note reports the size of moves only and says nothing about direction. Those 9 days come from about three episodes, and two of the three largest next-day moves in the window followed non-negative readings. Friday was monthly options expiry, though the reading was already minus 8.2 billion to minus 8.4 billion before expiry. This is a follow-up and calibration check on our July 20 note, which found the index ETFs in negative dealer gamma and the mega-cap stocks in positive.
Key takeaways
| What | Number |
|---|---|
| QQQ net dealer gamma, October 16 | -8.60bn dollars, the most negative of 69 weekday snapshots (June 29 to October 16, counting Friday). Spot 709.80, zero-gamma (flip) level 738.81, spot 3.93% below it (Kresmion options_gamma_exposure, modeled) |
| Distance below the flip level | -3.93% is the third deepest of 69, behind -4.18% on July 28 and -4.54% on July 29 |
| Next-day absolute move after gamma below -5bn | Average 1.40%, median 1.12%, n=9, from about three episodes (Kresmion gamma joined to closes, 68 matched days) |
| Other readings | Negative but above -5bn: 0.85% (n=33). Positive: 0.89% (n=26), median 0.71%. The standard deviation of next-day returns is 1.22% |
| Threshold-free check | Correlation of gamma with the next day's absolute move: -0.227 across 68 days, a t of about 1.9 before allowing for clustering, so not conventionally significant |
| Chip split, October 16 | Short gamma: SMH -0.92bn, AVGO -0.20bn, MU -0.10bn, AMD -0.08bn, INTC -0.03bn. Long gamma: MSFT +1.24bn, META +1.00bn, AAPL +0.78bn, AMZN +0.32bn, NVDA +0.26bn, GOOGL +0.19bn |
| Week, October 9 to 16 closes | QQQ -5.52%, Nasdaq Composite -4.48%, S&P 500 -1.95%, XLK -7.70%, IWM -3.05%, DIA (Dow ETF) +0.60% (Kresmion correlation_close_history) |
What the data shows
Dealer gamma is an estimate of how dealers must trade as prices move. Kresmion models dealers as long the calls and short the puts that customers trade. It does not observe dealer books, so every figure here is modeled. When the number is negative, the model's dealers sell as prices fall and buy as they rise, which adds to moves. When it is positive they do the opposite and dampen them.
QQQ's reading moved from +6.32bn on October 6 to -1.47bn on October 8, +1.25bn on October 9, -1.89bn on October 12 and -2.57bn on October 13. It then dropped to -8.41bn on October 14, -8.21bn on October 15 and -8.60bn on October 16. The table holds 84 QQQ rows from June 27 to October 16. Fifteen are weekend rows, and 11 of those repeat the prior spot, which makes them stale copies. We removed them, leaving 69 weekday snapshots. No weekday snapshot is below Friday's. The window maximum is +7.57bn on August 13.
Negative gamma is the usual state here: 43 of the 69 weekday readings (62%) are negative. SPY was at -10.94bn on Friday, 1.47% below its flip level of 774.67, but that is not a window extreme. SPY's low was -17.44bn on July 29, and 11 of its 84 rows are lower than the latest. Kresmion's July 1 note covered dealer gamma for the S&P 500, the Nasdaq 100 and the Russell 2000 as of June 30.
The week was a hard one. QQQ closed at 751.27 on October 9 and 709.80 on October 16. On Friday the S&P 500 closed at 7,659.44 (-1.09%), the Dow at 52,002.41 (-0.34%) and the Nasdaq Composite at 26,140.03 (-2.14%), and AP reported the S&P and Nasdaq had their worst week since June (AP via Yahoo Finance). Reuters reported the Philadelphia semiconductor index was down 8% in October and up more than 60% for the year. Gamma is computed from spot, so the gamma reading, the weekly price drop and the Reuters description of the week are one event. We do not count them as three confirmations, and our data does not show what drove the selling.
The chip split
The July note found the three big index ETFs short gamma and the mega caps long. On October 16 five chip and chip-related names were short gamma: SMH (-0.92bn, 13.06% below its flip level), AVGO (-0.20bn, 6.24% below), MU (-0.10bn), AMD (-0.08bn) and INTC (-0.03bn). Kresmion has no July readings for SMH, AVGO, MU or INTC, so whether this split is new is unknown. SMH and AVGO have been short gamma on about half of their snapshots since August (19 of 37 and 20 of 37). The long-gamma names were MSFT (+1.24bn, spot 20.59% above its flip), META (+1.00bn, 32.15% above), AAPL (+0.78bn, 10.32% above), AMZN (+0.32bn), NVDA (+0.26bn, 2.97% above) and GOOGL (+0.19bn). TSLA was at +0.01bn. XLK was at -0.05bn, 8.52% below its flip, and IWM at -3.78bn, 6.85% below.
NVDA, the largest chip stock, is long gamma, but only 2.97% above its flip. Each chip stock is small in dollars next to the index funds. How much of QQQ's own reading comes from chip strikes is unknown, and so is the conversion from gamma to dollars of hedging.
The mechanism
A common modeling convention assumes index ETF options carry large standing put-hedge demand from institutions. Once QQQ falls below the strike zone where that put open interest sits, the model's dealers are short gamma. To stay hedged they sell futures or shares into declines and buy into rebounds, so the hedging adds to moves in both directions. The same convention assumes single-name mega-cap options lean toward customer call buying, so MSFT, META and AAPL stay long gamma and their dealers lean against moves.
Two second-order points follow. First, the short-gamma names are SMH, AVGO, MU, AMD and INTC plus the index wrapper, while the platform names and NVDA carry long gamma. The five short names sum to about -1.3bn against QQQ's -8.60bn, so they cannot account for most of the index reading.
Second, the flip level moves. QQQ's flip slid from 750.17 on October 8 to 738.81 on October 16 as strikes and expiries changed. Spot would need to rise 4.09% to reach the October 16 flip level. The gap can also close if the flip level falls toward spot, or if spot rises, or both. The flip level shifted by less than 1 point on expiry day (739.72 on October 15, 738.81 on October 16), but it fell 11.4 points from October 8 to October 16, so it is not fixed.
QQQ closed at 661.73 on July 29 with gamma at -7.51bn, then rose 3.30% to 683.55 on July 30 and reached 723.85 on August 4, which is one rebound after a deep reading and does not show what caused it. That is one window and cannot be generalized.
Other explanations
Volatility clustering. Falling prices push gamma negative, because spot drops below the put strikes, and they also raise volatility on their own. The 1.40 versus 0.89 percent gap could simply be big moves following big moves, with gamma only marking a selloff in progress. The test does not control for prior-day realized volatility, so this cannot be ruled out.
Options expiry. October 16 was the monthly expiry, the third Friday. It does not explain most of the reading. QQQ gamma was already -8.41bn on October 14 and -8.21bn on October 15, before expiry, and the roll-off on Friday moved the net by only 0.39bn. Expiry removed call and put gamma almost equally.
Model convention. If customers were net put sellers, through put-write funds or overwriting, the real dealer sign would be the opposite. The estimate does not observe dealer books.
Price restatement. The reading went from -2.57bn to -8.41bn on October 14 as spot dropped 1.97%. Some of that change is likely price moving through strikes. Kresmion's data cannot separate it from new put positioning.
The base rate
The named window is Kresmion's options_gamma_exposure for QQQ, weekday snapshots from June 29 to October 16 (n=69). There is no history before June 27, so there is no multi-year base rate, and magnitude against a longer history is unknown. The median of all 84 rows is -1.19bn. Friday's -8.60bn ranks first of 69 with the current day counted. Nine trading days in the window have no snapshot, so this is the lowest of the 69 we hold, not of every session.
Next-day absolute moves, using the 68 days that have closes in correlation_close_history:
- Gamma below -5bn: average 1.404%, median 1.117%, n=9.
- Negative but above -5bn: average 0.850%, n=33.
- Positive: average 0.885%, median 0.713%, n=26.
The nine deep days are July 16, 23, 24, 27, 28 and 29, then September 10, October 14 and October 15. Their next-day moves were 1.50, 1.12, 0.31, 0.97, 2.04, 3.30, 0.77, 0.13 and 2.50 percent in size. Six fall between July 16 and 29, one on September 10 and two on October 14 and 15, so they are not nine independent trials. Friday itself has no next day yet and is not in the nine.
The -5bn cutoff was chosen after looking at the data, which flatters it. The threshold-free statistic is a correlation of -0.227 across 68 days, a t of about 1.9 before clustering, and it is not conventionally significant. For SPY the buckets barely separate: gamma below -8bn averaged 0.589% (n=15), other negative readings 0.559% (n=27) and positive readings 0.454% (n=26), with a correlation of -0.171.
The search space matters too. This note came out of a daily screen across several desks, and the full count of looks is magnitude unknown. Within the gamma table, 4 of 113 tickers sat at the minimum of their own weekday history on October 16, a history that differs by ticker (QQQ has 69 weekday rows, CMG, MSTR and SMCI 37). QQQ is among them and the only index product, so a rank-one reading for a single ticker is not rare. Across the 113 tickers on October 16, 43 had negative net gamma and 41 were below their flip.
The evidence against
Two of the three largest QQQ next-day moves in the window, 3.40% on August 4 and 2.88% on September 21, followed non-negative readings of +0.92bn (August 3) and +0.11bn (September 18). The second largest, 3.30% on July 30, followed a deep reading of -7.51bn. The second most negative reading, -8.41bn on October 14, was followed by a 0.13% day.
The 1.40 percent average also leans on three days: 2.04% (after July 28), 3.30% (after July 29) and 2.50% (after October 15). The other six deep days were all about 1.50% or less, and the median of the nine is 1.12%. At the 1.22% standard deviation of next-day returns, the deep-bucket average is not far from an ordinary day. Without those three days, the other six deep days average 0.80%, below the 0.89% positive-gamma average. The standard deviation of the nine is 1.04, so the standard error of the 1.40% mean is about 0.35. With three episodes, a different cutoff could give a different answer.
What would change the read
1. Monday's snapshot, written at about 21:17 UTC after the close. If QQQ gamma returns above about -5bn with spot little changed, the Friday reading was less persistent than it looks. 2. Realized moves from Tuesday October 20 to Friday October 23. If QQQ's average absolute daily move stays below 0.89% while gamma stays below -5bn, the calibration gap weakens. If it is above 1.40%, the gap holds for a fourth episode. 3. QQQ closing above its flip level (738.81 as of October 16, which can shift), or the flip falling to spot. 4. Lam Research and Texas Instruments report on Wednesday, with Meta also due this week, according to Reuters. These are single-name events in or near the chip layer, where gamma is negative. 5. The Fed meeting later this month. CME FedWatch put the chance of a hike this month at 16% on October 19, as cited by Reuters, and 92% for an increase in December.
On Friday QQQ closed at 709.80 and its modeled flip level was 738.81.
Frequently asked questions
What is dealer gamma?
It is a modeled estimate of how options dealers must trade as the price moves. Kresmion assumes dealers are long customers' calls and short customers' puts. Negative gamma means their hedging adds to moves, and positive gamma means it dampens them. The model does not see dealer books.
Is minus 8.60 billion dollars a record for QQQ?
It is the lowest of the 69 weekday snapshots from June 29 to October 16, counting Friday. Kresmion has no earlier history, so it is not a record in any longer sense.
Does negative gamma predict a bigger move?
In this window the 9 days below -5bn averaged a 1.40% next-day move in size, against 0.89% after positive readings. Those days come from about three episodes, the threshold was picked after looking, and the correlation of -0.227 is not conventionally significant. The note says nothing about direction.
Which stocks are short gamma?
On October 16, SMH, AVGO, AMD, MU and INTC were short gamma. MSFT, META, AAPL, AMZN, GOOGL and NVDA were long.
Did options expiry distort Friday's number?
Probably not by much. The reading was already -8.41bn and -8.21bn on the two sessions before expiry, and expiry moved it by only 0.39bn. Monday's snapshot will show whether the reading persists.
Sources
Kresmion research page for QQQ: lists Kresmion's prior notes on QQQ. The gamma snapshots (latest October 16, fetched 21:17:19 UTC) and closes are from Kresmion's options_gamma_exposure and correlation_close_history tables, queried October 19.
Kresmion note, July 20, 2026: the prior framing this note tests.
AP via Yahoo Finance, How major US stock indexes fared Friday 10/16/2026: index closes and the worst week since June for the S&P 500 and Nasdaq.
Reuters via Business Recorder, Wall Street Week Ahead: semiconductor index down 8% in October, earnings from Meta, Lam Research and Texas Instruments.
Reuters via Business Recorder, Gold edges higher on softer oil, Fed rate outlook in focus: CME FedWatch probabilities of 16% for October and 92% for December.
Kresmion note, July 1, 2026: earlier Kresmion note on dealer positioning in the S&P, the Nasdaq and the Russell 2000.