By Kresmion Research, October 22, 2026
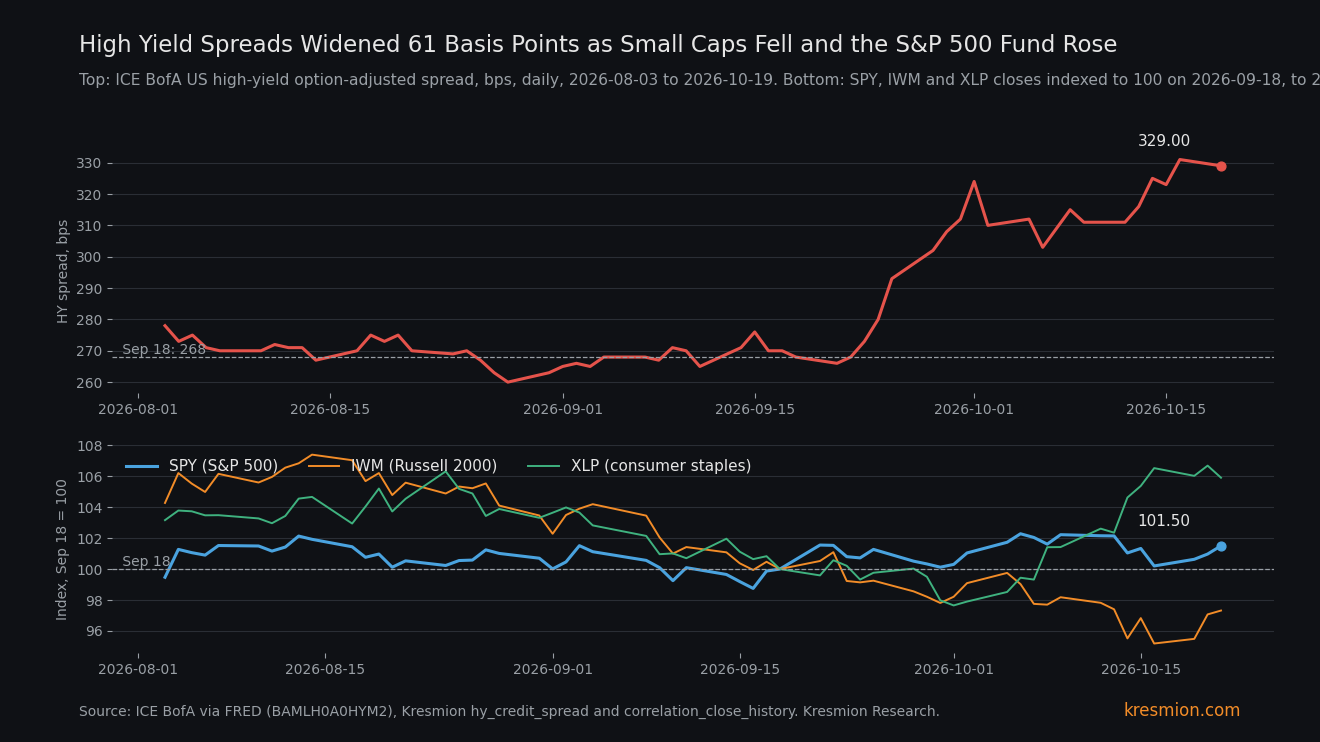
The ICE BofA US high-yield spread widened 61 basis points in 21 sessions to 329 on October 19, while the S&P 500 fund SPY rose 0.63 percent over those dates. The spread is the extra yield investors demand to lend to heavily indebted companies instead of the US Treasury. It went from 268 on September 18 to 329 on October 19, and FRED shows 333 on October 20. Only 22 of 828 such 21-session windows since July 25, 2023 widened as much. Inside the stock market the picture differs: the Russell 2000 fund IWM fell 4.51 percent, while staples, health care and energy funds rose 4.7 to 6.1 percent over the same dates. The level is ordinary and the history is short, so this note describes composition and makes no call on direction.
Key takeaways
| What | Number |
|---|---|
| HY spread, September 18 to October 19 | 268 to 329 bps, up 61. FRED: 333 on October 20 (Kresmion hy_credit_spread; FRED BAMLH0A0HYM2 is the same series) |
| Rarity of the widening | 22 of 828 21-session windows since 2023-07-25 are at or above +61 bps (2.7 percent). The windows overlap: 19 of the 22 sit in March to April 2025, one in August 2024 and two are the current ones, so they come from about three episodes |
| SPY over the same dates | +0.63 percent (761.69 to 766.48). In the three earlier episodes of 50 bps or more, SPY was down 1.0 to 12.2 percent |
| Small caps, JPMorgan and financials | IWM down 4.51 percent, JPM down 4.62, XLF down 1.08 |
| Gainers over the same dates | XLP up 6.02, XLV up 4.71, XLE up 6.05, UNH up 7.95, MSFT up 8.05, BRK-B up 4.41 |
| SPY against the credit fit | 4.93 points above the line; 19 of 758 windows are at or above that |
| IWM against the credit fit | 2.69 points above the line; 150 of 758 windows are at or above that, an ordinary reading |
| IWM minus SPY, 21 sessions | Down 5.14 points; 223 of 6,619 rolling windows since 2000-06-27 are at or below (3.4 percent) |
What the data shows
Our hy_credit_spread table (latest row 2026-10-19) shows the spread at 268 on September 18, a low of 266 on September 21, a peak of 331 on October 16 and 329 on October 19. Our copy of FRED's BAMLH0A0HYM2 carries identical values and 3.33 percentage points on October 20, so the two count as one source. Investment-grade spreads (FRED BAMLC0A0CM) went from 0.77 to 0.87 percentage points (77 to 87 bps) over the same dates. The 10-year Treasury yield (FRED DGS10) went from 5.01 to 5.15 percent.
Three earlier widenings of 50 bps or more sit in the table: October 2023, August 2024 and March to April 2025. SPY was down in every window, between 1.0 and 12.2 percent. Of the 21 matched windows at or above +61 bps, only 2 had SPY up. Across 758 matched windows, the 21-session change in the spread has a correlation of -0.796 with SPY's return, -0.779 with IWM's and -0.680 with QQQ's. A line fitted to SPY has a slope of -0.0928 percentage points per basis point and an intercept of 1.359, which puts the fitted SPY return at about minus 4.3 percent for a 61 bp widening. SPY's actual +0.63 percent sits 4.93 points above that line (standard deviation of the gap 2.20), a gap matched or beaten in 19 of 758 windows, or 2.5 percent.
Breaking SPY apart changes the read. From September 18 to October 19 (our correlation_close_history), IWM fell 4.51 percent (284.11 to 271.28), JPM 4.62 and XLF 1.08, with XLI down 1.54 and XLK down 1.81. XLP rose 6.02, XLV 4.71, XLE 6.05, UNH 7.95, MSFT 8.05 and BRK-B 4.41. QQQ was down 0.32. VIX went from 14.81 to 18.44. The data does not show what drove any of these single-name or sector moves.
IWM sits 2.69 points above its own credit-fit line (standard deviation 3.32), which 150 of 758 windows match or beat. That is an ordinary reading. IWM's 21-session return minus SPY's was down 5.14 points, matched or beaten in 223 of 6,619 rolling windows since June 2000 (3.4 percent; mean +0.06, standard deviation 2.90).
The mechanism
A high-yield spread widens when investors reprice default or liquidity risk. Over these 21 sessions the 10-year Treasury yield rose 14 bps to 5.15 percent, and the last close before 2026 at or above that level was July 9, 2007. The spread rose on top of it, so all-in borrowing costs for these issuers rose by roughly the sum of the two. That sum is rough: we compare endpoints, and the 10-year peaked at 5.31 on October 5 and was 5.09 on October 16. Those costs bite first on smaller, more indebted and floating-rate borrowers. Our reasoning is that such firms make up more of the Russell 2000 and of banks than of an S&P 500 dominated by cash-rich megacaps. We did not query index constituents or weights, so that step is an inference.
Within equities, the moves differed by sector in this window. Small caps, financials and industrials fell while staples, health care, energy (oil near 100 dollars) and a few megacaps rose, and VIX climbed. The SPY level netted those moves to +0.63 percent. A reader watching only the S&P 500 level sees that figure and misses the 4.51 percent fall in small caps. On our fit, SPY sits 4.93 points above the credit line (19 of 758 windows at or above) and IWM sits 2.69 points above it (150 of 758). We chose this breakdown after seeing the data.
Other explanations
Oil composition. Oil near 100 dollars lifts energy equities (XLE up 6.05 percent). We did not compute index weights, so we cannot say how much of SPY's move that explains. Fuel-cost losers such as airlines, consumer firms and chemicals could be driving non-energy high yield wider. We could not test this: FRED was in maintenance when we tried the CCC spread series (BAMLH0A3HYC) on October 22, and our database has no sector spreads. If it holds, the divergence is a sector-mix effect and says little about risk appetite.
Technical credit supply. Heavy new issuance or fund outflows can widen spreads without any change in default risk. Our bond_issuances table lists SEC-filed debt offerings but has no credit-rating field, and we hold no share counts for high-yield ETFs, so we cannot separate high-yield supply or fund flows from the spread move. HYG's price fell 2.16 percent, but that includes distributions and its October 19 and 20 closes are identical to eight digits, a possible stale row, so we do not use it as evidence.
Single-stock news. A few large names had their own stories (MSFT, UNH, META), so SPY's resilience may be idiosyncratic. We did not compute their contributions.
Rate expectations. Kitco reports Fed tightening expectations ahead of the decision on October 28. Tighter policy would hit indebted borrowers and small caps first and produce this pattern with no disagreement between markets.
The base rate
A 21-observation change of +61 bps or more occurred in 22 of 828 windows from July 25, 2023 to October 19, 2026 (2.7 percent; mean minus 2.1 bps, standard deviation 30.7, about 2 standard deviations). Overlapping windows inflate that count. 19 of the 22 fall in March to April 2025; the rest are one August 2024 window and the two current windows. At the lower 50 bps threshold the history adds October 2023, for four episodes in all. With three earlier cases, "SPY always fell" is a small-sample observation. The level is ordinary: 224 of 849 days were at or above 329, the table mean is 315 and the maximum is 461 on April 7, 2025. The window is short, about 3.25 years, because hy_credit_spread starts on 2023-07-25 and our FRED copy on 2025-09-30. Twelve rows in the table carry weekend dates, so a 21-observation window is not always 21 sessions; counting weekdays only gives 23 of 816.
The search space matters. Our desk scanned about 40 data series before flagging high yield; at the 97th percentile, one or two nominal extremes would turn up by chance, so the spread change alone is weak evidence. We then tested three index fits (SPY, IWM, QQQ), one 26-year relative-return distribution (IWM against SPY) and about 30 descriptive returns. The composition breakdown was chosen after seeing the data, so it is descriptive, and we did not specify it before looking. On independence, investment-grade spreads are the same index family on a different universe and partly corroborate. SPY, IWM, the sector funds and VIX are one US equity market, and VIX is derived from S&P options. The two markets share macro drivers, so we make no convergence claim and use none of our composite signal scores.
The evidence against
The level is the strongest point against any "credit is flashing" reading. At 329 to 333 bps the spread is close to its table mean and far below the 461 of April 7, 2025, and 224 of 849 days since July 2023 were wider. Investment-grade spreads are 87 bps. By October 21, equities were easing: SPY reached 773.09 (up 1.50 percent since September 18), IWM was down 2.68 percent, and VIX was 16.68 against 19.99 on October 16. The S&P 500 closed at 7,757.17 and the Russell 2000 at 2,781.02 that day (Kitco, matching our ^GSPC close). A fast widening from a very tight start (266 on September 21) can be normalisation. The prior-episode comparison rests on three cases.
What would change the read
The FRED BAMLH0A0HYM2 prints for October 21 to October 30. The levels below (3.00 and 3.50 percent, 770 for SPY and minus 2 points) are round reference levels we chose, not figures derived from a query. A return below 3.00 percent while IWM stays at or above its October 21 close of 276.48 would point to a technical or normalising widening and the divergence would fade. A move above 3.50 percent with SPY still near 770 would widen the gap toward the scale of earlier episodes. Flash October PMIs on Friday, October 23 at 9:45 am ET (Kitco) and the Fed decision on October 28 (Babypips) come next. A hawkish outcome would test whether small caps and high yield keep moving together. The IWM minus SPY 21-session gap moving back above minus 2 points would undercut the composition explanation. If a CCC or sector spread series becomes fetchable and shows the widening concentrated in energy-sensitive or fuel-cost sectors, the oil explanation gains weight. The data cannot say which market will turn out to be right, or how large any later price effect would be. The latest high-yield spread in our table is 329 bps, dated 2026-10-19.
Frequently asked questions
How much did the high-yield spread widen?
From 268 bps on September 18 to 329 on October 19 in our table, up 61. FRED shows 333 on October 20. Only 22 of 828 21-session windows since July 25, 2023 are at or above +61 bps.
Did the S&P 500 ignore it?
SPY rose 0.63 percent over the same dates. Staples, health care and energy funds rose 4.7 to 6.1 percent, while IWM fell 4.51 percent, JPMorgan 4.62 and financials (XLF) 1.08.
Is this like earlier widenings?
In the three earlier episodes of 50 bps or more, SPY was down 1.0 to 12.2 percent. Three cases are a small sample and cannot be read as a rule.
Is 329 bps a high level?
No. 224 of 849 days since July 2023 were at or above it, the table mean is 315, and the maximum is 461 on April 7, 2025.
What is the next data point?
FRED's prints for October 21 to October 30, flash PMIs on Friday, October 23 and the Fed decision on October 28.
Sources
FRED, ICE BofA US High Yield Index Option-Adjusted Spread (BAMLH0A0HYM2): 2.68 on September 18, 3.29 on October 19, 3.33 on October 20; values read from our fred_series_history because the FRED site was in maintenance when we tried to fetch it on October 22.
FRED, ICE BofA US Corporate Index Option-Adjusted Spread (BAMLC0A0CM): investment-grade spread 0.77 to 0.87, read from our fred_series_history.
FRED, 10-Year Treasury Constant Maturity (DGS10): 5.01 to 5.15 percent, with the last pre-2026 reading at or above 5.15 in July 2007, read from our fred_series_history.
FRED, CBOE Volatility Index (VIXCLS): VIX 14.81 to 18.44, read from our fred_series_history.
Kitco, PM Report, October 21, 2026: October 21 index closes, Fed tightening expectations, and the Friday PMI calendar.
Babypips, Financial and Forex Market Recap, October 21, 2026: Fed decision on October 28.