By Kresmion Research, October 23, 2026
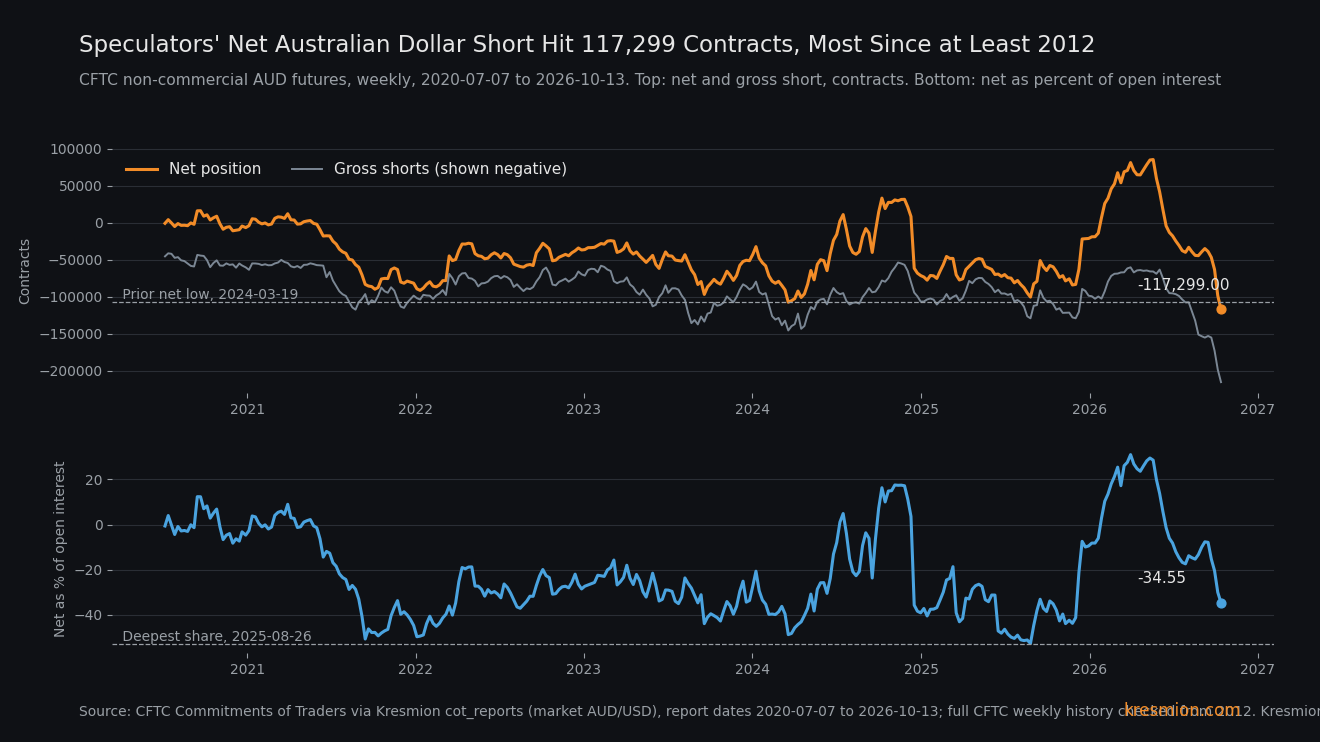
Speculators held a net short of 117,299 Australian dollar futures contracts on Tuesday, October 13, the largest in the CFTC's own weekly data back to 2012. Speculators here means CFTC non-commercial traders. They were short 215,688 contracts against 98,389 long, on open interest of 339,464, while Australia's policy rate of 4.60 percent sits above the US midpoint of 3.875 percent. We say "back to 2012" because before that year we read only about one week in seven of the CFTC file. Measured against open interest the position is ordinary, and the data we hold is ten days old.
Key takeaways
| What | Number |
|---|---|
| Net position, report for Tuesday October 13 | -117,299 contracts: 98,389 long, 215,688 short, open interest 339,464, net -34.55% of open interest (Kresmion cot_reports, market AUD/USD) |
| Rank in the CFTC's weekly file | Most negative of 772 weekly reports, 2012-01-03 to 2026-10-13. Prior low -107,538 on 2024-03-19 (CFTC history, read in full) |
| Rank in our table | 1 of 328 weeks since 2020-07-07. The short count of 215,688 is also the highest of the 772 weeks; the highest before September 2026 was 145,745 (2024-03-19) |
| Three-week build from September 22 | Net -46,814 to -117,299, a fall of 70,485. Shorts rose 60,341 (about 86% of the change), longs fell 10,144. The short addition is the largest of 325 three-week windows in our table |
| Carry | Policy rates, October 2026: Australia 4.60%, US 3.875% midpoint, a gap of 0.725 points (BIS via Kresmion central_bank_rates) |
| Qualifier | As a share of open interest, 93 of 328 weeks were deeper; the deepest was -52.61% on 2025-08-26 |
| Breadth | EUR/USD and GBP/USD nets are also at 328-week lows in the same report |
What the data shows
The CFTC publishes its Commitments of Traders report on Fridays for positions held the Tuesday before. The report for October 13 is the latest we hold for all 20 markets in our table. The CFTC's schedule lists releases today, October 23, and on October 30 (CFTC), so the October 20 positions are out today and not yet loaded on our side.
The position was built quickly from the first clean week after the September expiry. On September 22 the net was -46,814 on open interest of 306,488. It then ran -63,239 (September 29), -98,588 (October 6) and -117,299 (October 13). Over those three weeks shorts rose from 155,347 to 215,688, and longs fell from 108,533 to 98,389. Because 60,341 of the 70,485 contract change was new shorts, this was mostly added selling, with longs down only 10,144. The three-week net change ranks 4 of 325 windows; the three larger ones, from 2024-12-17 (-93,307), 2024-12-24 and 2024-12-31, sit around the December 2024 expiry.
We start from September 22 because open interest fell from 493,141 on September 15 to 306,488 on September 22 at the quarterly roll, which distorts comparisons across that week.
To call the level the largest back to 2012 we read every weekly CFTC report for the contract from 2012-01-03 to 2026-10-13, 772 in all, by combining three offset pulls of the CFTC file. The largest net short in 2012 to 2018 was -76,851 (2015-03-10). The short count of 215,688 is the highest of the 772 weeks, and the highest in 2012 to 2018 was 111,397 (2015-11-17). Before 2012 we read a thinned pull of the CFTC file, about one week in seven, from 1987 to 2011. In that sample the largest net short was 11,327 contracts (2006-03-21) and open interest never exceeded 152,865 (2011-03-08). We did not check every pre-2012 week, so we make no all-time claim.
The mechanism
The short is held against the carry. A speculator short in Australian dollars gives up the rate gap, which at policy rates is 0.725 points a year (4.60 percent against 3.875 percent). We have not measured what the futures position costs in practice, so that figure is the policy-rate gap and nothing more precise. The domestic data also leaned the other way. Australian CPI rose 4.0 percent in the year to August, up from 3.5 percent in July, though trimmed mean inflation was unchanged at 3.6 percent and automotive fuel was up 13.5 percent over 12 months (ABS). On October 21 in Sydney (reported at 21:56 GMT on October 20), RBA Deputy Governor Hauser said the inflation outlook looked worse than forecast, without pre-announcing a hike, ahead of the November 3 decision (investingLive).
Three channels could explain a short anyway. The first is Asian demand. The Australian dollar is often used as a proxy for Asian demand and commodity-linked growth, and it trades around the clock. A trader who wants one future to express "Asia growth risk" or "dollar strength" may choose it. We note the timing: the October 22 selloff in Asian chip-heavy markets (Kospi -3.52 percent, Nikkei -2.65 percent) and Brent's settle of 113.17 came after the October 13 report date (CappNotes), so they cannot have driven the build, though they matter for whether it is working. COT does not record why traders hold a position.
The second is the long end. The gap between Australian and US 10-year yields peaked at +0.68 in March (4.926 against 4.246, monthly averages) and was +0.29 in September (5.283 against 4.989), using OECD data for Australia and the Federal Reserve's H15 series for the US. That thins the yield cushion a long-Australian-dollar holder earns on duration, but the gap has been flat between +0.29 and +0.36 since June, so it cannot explain a build that began in late September.
The third is trend following. The Australian dollar fell 2.3 percent over the three build weeks, from 0.7119 on September 22 to 0.6956 on October 13, and shorts grew as it fell. It had already slipped 1.4 percent from 0.7221 on September 8 to 0.7119 on September 22, with shorts flat.
The second-order point is exposure. A crowded side that pays carry faces two scheduled domestic events: September CPI on October 28 (Australian time) and the RBA decision on November 3 at 2:30pm AEDT (The Adviser). A short this large and this recent is more exposed to a hawkish domestic surprise than a carry-neutral position. The AUD has already risen 0.77 percent from the October 13 close to 0.7010 at 05:17 UTC today, after a low close of 0.6919 on October 16. The data cannot say at what prices the shorts were opened, so it cannot say how many are losing money.
Other explanations
Four readings compete with "a view on Australia".
A dollar-wide trade. In the same report the EUR/USD net was -137,573 (rank 1 of 328, three-week change -85,239) and GBP/USD -106,964 (rank 1 of 328, -24,396). NZD/USD net shorts grew by 35,621 over the three weeks and CAD/USD by 41,555. If the Australian dollar is one leg of a basket short against the US dollar, the record says little about Australia. Against that, the Australian three-week short addition (60,341) is the largest of 325 windows in its own history. But NZD/USD's addition (38,669) is also the largest in its own history, EUR/USD added more contracts (87,460, second in its own history, net change -85,239 against -70,485 for AUD), and only sterling moved much less (net -24,396). The speculator net in the US dollar index contract is mid-range at +12,919 (rank 193 of 328), so the build does not show in that contract.
A bigger market. Open interest is 339,464, against roughly 150,000 to 200,000 in 2021 and 2022. A larger futures market sets contract-count records with no change in conviction, which is why we also report the share of open interest.
Hedging and relative value. Funds that hold Australian equities, miners or bonds may hedge the currency in futures, and a non-commercial short can be the currency leg of a cross-asset trade. Those show as speculator shorts with no directional view, and the COT report cannot separate them.
Trend following. The build tracked the price fall, so it may be reacting to price.
The base rate
In the CFTC's 772 weekly reports since 2012 the net of -117,299 is the lowest, and the prior low was -107,538 on 2024-03-19. In our 328 weeks since 2020-07-07 it ranks 1. The short count of 215,688 is the highest of the 772. The three-week short addition of 60,341 ranks 1 of 325 windows, and the three-week net change ranks 4 because the three larger ones came when longs were liquidated around the December 2024 expiry.
The denominator changes the picture. Net short as a share of open interest is 34.55 percent, and 93 of 328 weeks were deeper, which puts it about 28 percent of the way in from the deep end. The deepest was 52.61 percent on 2025-08-26, when the contract count was only -100,590.
On the search space: we ranked 20 COT markets against their own histories, and re-ranked 12 for this note. With 20 markets, a 1 in 328 chance each week that a given market sits at its own low makes about a 6 percent chance that at least one does, and because positioning series persist from week to week the true chance is higher, so one extreme in a scan is unremarkable. Three non-dollar currencies at their lows together points to a common dollar factor, which is our first alternative. The 772-week check was run only for the Australian dollar, so the "back to 2012" claim rests on one market chosen before the check. Positioning and price are separate sources but not independent evidence, because trend following links them mechanically, so we do not treat them as converging. The policy rates, long yields, CPI and RBA commentary describe the backdrop and do not confirm the bet.
The evidence against
By the measure that adjusts for market size, the position is not extreme: 93 of 328 weeks were deeper, and most of the contract-count record reflects a market that has roughly doubled. The Australian dollar has also risen since the report date, to 0.7010 at 05:17 UTC on October 23, up 1.32 percent over a week and 0.77 percent above the October 13 close. And the positions are ten days old. The October 20 report, released today, may already show covering.
What would change the read
Today's CFTC release (positions as of October 20) and the October 30 release (positions as of October 27). A net short back inside -98,588, the October 6 level, or shorts below 198,726, would mean the build has stalled or reversed. Then the two domestic events: Australian September CPI on October 28 (Australian time) and the RBA decision on November 3. The FOMC decides on October 28 US time, after the Australian CPI release, and the Bank of Japan on October 30 (Robert Savage).
Breadth is the other test. If the EUR and GBP net shorts shrink while the Australian shorts hold, the position is specific to Australia. If all three shrink together, it was a dollar trade. On price, a return above 0.7119, the September 22 close when the build began, with shorts unchanged would also change the read. The Australian dollar was 0.7010 at 05:17 UTC on October 23.
Frequently asked questions
Is this a record Australian dollar short?
It is the largest net short in the CFTC's weekly data back to 2012: -117,299 contracts on October 13, 772 weeks checked, prior low -107,538 on 2024-03-19. Before 2012 we read only about one week in seven, so we do not claim an all-time record.
Is the position large compared with the market?
Less so. As a share of open interest it is 34.55 percent net short, and 93 of the 328 weeks since July 2020 were deeper. The deepest was 52.61 percent on 2025-08-26.
What does it cost speculators to hold the short?
At policy rates, about 0.725 points a year: Australia 4.60 percent against a US midpoint of 3.875 percent (BIS, October 2026). We have not measured the actual cost of the futures position.
Is this a view on Australia or on the dollar?
This report cannot separate the two. EUR/USD and GBP/USD nets are also at 328-week lows, and EUR/USD and NZD/USD added shorts at a similar pace over the same three weeks, which fits a dollar-wide trade. Sterling moved less.
What are the next dates?
The CFTC releases October 20 positions today and October 27 positions on October 30. Australian September CPI is on October 28 (Australian time), and the RBA decides on November 3 at 2:30pm AEDT.
Sources
CFTC, Commitments of Traders 2026 release schedule: Friday releases on October 23 and October 30 for Tuesday data.
ABS, Consumer Price Index, Australia, August 2026: CPI 4.0 percent in the year to August, 3.5 percent in July; September CPI due October 28.
The Adviser, When will the RBA meet in 2026?: RBA decision on November 2 to 3, announced 2:30pm AEDT on day two.
investingLive, RBA's Hauser says inflation outlook worse than forecast ahead of 3 November decision: Hauser's October 21 Sydney remarks, published October 20 GMT.
CappNotes, Closing Look, Thursday, October 22, 2026: Kospi and Nikkei moves and the Brent settle on October 22.
Robert Savage, The Week Ahead: Contagion: FOMC on October 28 and Bank of Japan on October 30.