
By Kresmion Research, October 29, 2026
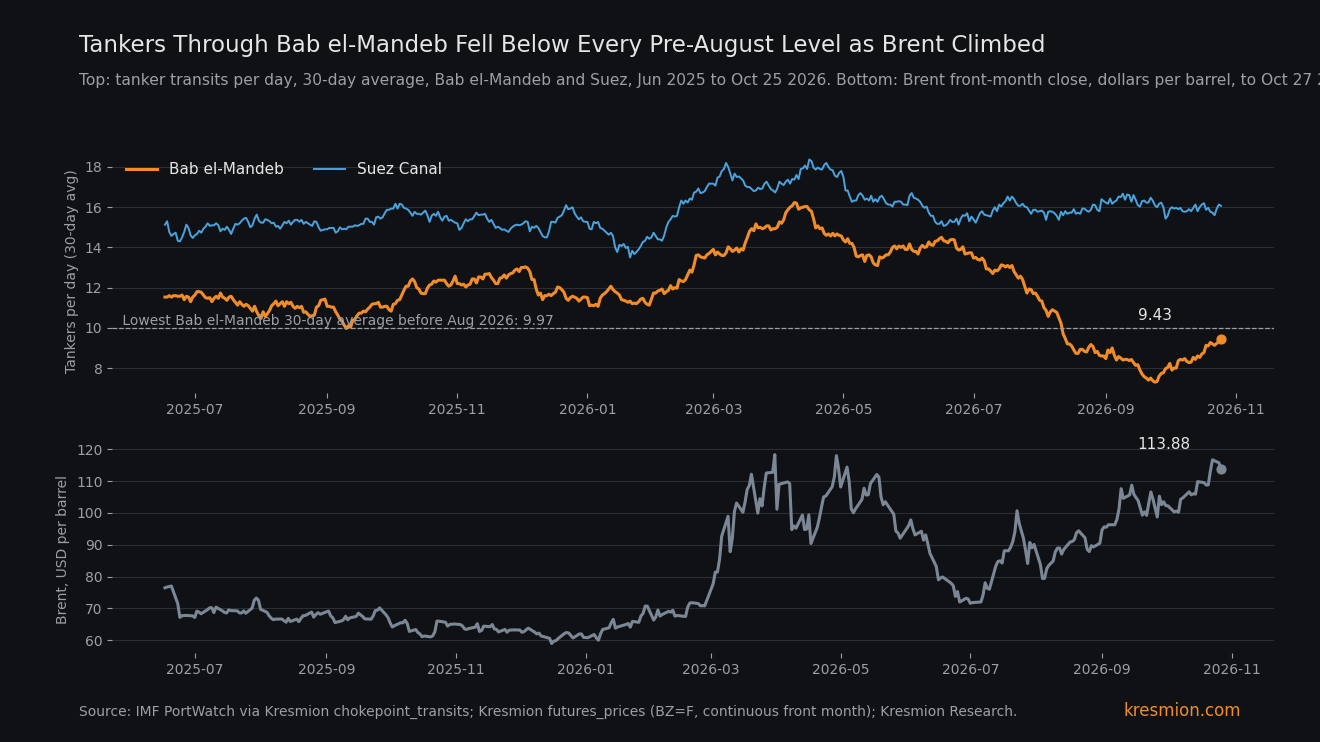
Tanker transits through Bab el-Mandeb, the Red Sea's southern exit, have run about 40 percent below spring pace since August while Brent climbed 28 percent. PortWatch counts in our chokepoint_transits table average 8.56 tankers a day from August 1 to October 25, against 14.29 from March to June and 11.78 before March. Brent's front month went from 89.22 on July 20 to 113.88 on October 27. Suez tanker counts, the other Red Sea exit, held flat over the same stretch, so they do not show the change. Tanker counts fell while Brent rose, but the timing is loose, and this note sets out both.
Key takeaways
| What | Number |
|---|---|
| Bab el-Mandeb tankers per day (PortWatch, chokepoint_transits) | 8.56 from Aug 1 to Oct 25 (86 days); 14.29 from Mar 1 to Jun 30; 11.78 before Mar 1. Aug to Oct is 40.1 percent below Mar to Jun and 27.3 percent below pre-March |
| 30-day average, 496 windows from 2025-06-17 to 2026-10-25 | All 75 windows since 2026-08-12 sit below 9.97, the lowest 30-day average before August (September 2025). Low 7.30 on 2026-09-24; latest 9.43 on 2026-10-25 |
| Suez Canal tankers per day | 16.13 (Aug 1 to Oct 25) against 16.53 (Mar to Jun), down 2.4 percent |
| Brent front month (BZ=F) | 89.22 on 2026-07-20 to 113.88 on 2026-10-27, up 27.6 percent. 36 of 2,591 closes since 2016-07-19 were at or above 113.88 |
| Weekly correlation, Bab el-Mandeb tankers with Brent | 0.10 over 34 weeks from 2026-03-02 |
| Lloyd's List Intelligence dates | A Houthi blockade of Saudi Arabia's Red Sea ports from 20 July; an attack that halted Yanbu crude exports in the week of 13 September |
What the data shows
PortWatch, the IMF's ship-tracking data, counts vessels by type as they pass each chokepoint. Our table holds 525 daily rows for Bab el-Mandeb, from 2025-05-19 to 2026-10-25. Monthly tanker averages there were 13.7 a day in June 2026, 11.6 in July, 8.5 in August, 8.0 in September and 9.3 for October 1 to 25. Total transits fell too, from 36.2 a day in June to 27.3 in August, 26.6 in September and 28.1 in October. Average daily capacity, which covers all vessel types, fell from 1,368,111 in March to June to 921,845 from August 1 to October 25, down 32.6 percent.
Other vessel types moved differently. Containers rose to 6.1 a day in October, the highest month of 2026, while dry bulk fell from 10.7 in June to 7.5 in October. Across the 28 chokepoints in the table, Bab el-Mandeb's tanker change between the two windows is the third largest fall, after the Kerch Strait (down 99.1 percent) and Hormuz (down 47.4 percent). Cape of Good Hope tankers fell 6.5 percent.
Suez looks different. Tankers there averaged 16.53 a day from March to June and 16.13 from August 1 to October 25. The 30-day Suez average ranged from 13.50 to 18.37 across the 496 windows, so the recent figure is ordinary.
The mechanism
When Hormuz shut in March, Saudi Arabia moved crude west through the East-West pipeline to Yanbu on the Red Sea. If that routing held, cargo bound for Asia would pass Bab el-Mandeb and cargo for Europe would go north through Suez, but our counts have no direction field and cannot show it. Bab el-Mandeb tankers averaged 14.29 a day in March to June, against 11.78 before March. But the rise began before Hormuz closed: January was 11.4 and February 13.7, so only part of the spring level can be tied to the Yanbu bypass. Hormuz tankers fell from 39.91 a day before March to 1.19 from August 1 to October 25.
Lloyd's List Intelligence, a separate publisher, dates a Houthi blockade of Saudi Arabia's Red Sea ports from 20 July. Its October 1 brief says that the rerouting of Saudi oil lifted Suez crude transits, with weekly Suez crude transits averaging 67 (9.4 million deadweight tonnes) from 20 July to the week of 13 September, against 53 in January and February. The same brief says an attack halted crude exports from Yanbu that week, and that VLCCs later resumed Yanbu liftings with the pipeline at reduced rates. Our 30-day Bab el-Mandeb tanker average was 12.80 on July 20 and 7.30 on September 24.
The second-order point is about where the thinning sits. Tanker counts at the southern exit fell while the northern exit stayed open, so Suez tanker counts look normal. The physical change is about 5.7 tankers a day in PortWatch counts. PortWatch shows Hormuz down by about 38.7 tankers a day, but Lloyd's counts far more Hormuz transits, so we cannot say how the two straits compare in lost volume, or whether Bab el-Mandeb is the last open route.
Other explanations
Four rival readings compete with this one.
Hormuz escalation. Lloyd's Hormuz Brief of October 22 counts at least 28 attacks or security incidents in the first half of October, the highest monthly total since the war began, and says UKMTO considers attacks underreported. On this reading Brent's climb comes from the Gulf, and the Red Sea counts coincide with it.
A feed artefact. Lloyd's reports tankers operating "dark" near Yanbu that later reappeared laden. PortWatch and Lloyd's both rest on ship transponder data (AIS), so part of the tanker drop may be ships not broadcasting rather than ships not sailing. Lloyd's total Bab el-Mandeb transits, 280 a week over four weeks to 27 September against 257 in January, do not show a fall below the pre-crisis level that PortWatch shows.
A mix shift unrelated to Saudi crude. Lloyd's says Black Sea security reduced Russian and Ukrainian bulk flows through the Red Sea, and Russian crude to India dominates Suez tanker traffic, so other tanker trades may account for part of the change.
Macro and contract mechanics. Newsquawk flagged a hot September PPI, and the front-month continuous Brent series mixes contract months. One roll is flagged in our table since July, on 2026-08-03.
The base rate
Our window is 496 rolling 30-day averages of daily Bab el-Mandeb tanker transits, from 2025-06-17 to 2026-10-25. Before August 2026 the lowest was 9.97 (September 2025) and the highest 16.23 (April 8, 2026). The first window below 9.97 closed on 2026-08-12, and all 75 windows since then are below it. The latest, 9.43 on October 25, ranks 73rd lowest of 496. This is a 17-month window of the strait's history. The 2023 to 2024 Houthi campaign years are outside it, so we make no record claim.
For Brent, 36 of 2,591 front-month closes since 2016-07-19 were at or above 113.88, the top 1.4 percent. Before 2026 the last such close was 2022-06-30, and the series maximum is 127.98 on 2022-03-08.
The search space matters. Our desk ran many chokepoint comparisons and we cannot give a reproducible count, and we added one 28-port tanker comparison and three correlation windows, all reported here. The Bab el-Mandeb hypothesis came from Lloyd's dating of the blockade and from a market commentary citing Yemen fighting, which limits forking paths, but the link to Brent is exploratory.
The evidence against
Brent averaged 99.60 in March and 104.09 in May, exactly when Bab el-Mandeb tanker counts were at their highest (30-day peak 16.23 on April 8). The weekly correlation between the two since March is 0.10 over 34 weeks. It was 0.08 over the 40 weeks from 2025-05-26 to 2026-02-28. The one negative reading, -0.48 over 21 weeks from 2026-06-01, uses a start date we chose after seeing the data. Brent had also climbed 23 percent from 71.57 on July 1 to 88.10 on July 17, before the July 20 blockade date. Our osint_events log Iranian attacks on tankers in Hormuz and a US revocation of Iran's oil export licence on July 7, but we have not tested what drove the move. The data cannot say how much of Brent's move is the Red Sea.
Timing is a second problem. Brent closed at 90.12 on July 31 and 90.49 on August 31, while the daily tanker average fell from 13.11 (July 1 to 19) to 9.17 (July 20 to 31) and 8.27 (August 1 to September 13). Only 1.4 percent of the 27.6 percent rise from July 20 had happened by the end of August. Brent did reach 100.69 on July 23, three days after the blockade date, and was back at 88.52 on August 14. Most of the rise came in early September (104.61 on September 11), when tanker counts were flat at 8.5 a day in August and 8.0 in September.
The sources also disagree on scale. Lloyd's total Bab el-Mandeb transits for the four weeks to 27 September were above January's, while PortWatch shows September total traffic 20 percent below January. At Hormuz, Lloyd's counted at least 104 non-Iranian-linked vessels from October 5 to 11, against PortWatch's 3.5 transits a day in October, so PortWatch can undercount war zones badly. Lloyd's October 15 brief puts Bab el-Mandeb transits 16 percent below the tanker-driven peak, but it also has September up about 4 percent on August and up 16 percent on a year earlier. PortWatch shows total transits down 2.5 percent on August (27.26 to 26.57 a day) and about 21 percent below September 2025. The two sources disagree on scale and on the recent direction.
What would change the read
Lloyd's next Red Sea Brief is due on its fortnightly cycle (the last was October 15), and its Hormuz Brief is due November 5. A Bab el-Mandeb tanker count back at the spring peak, or a lifted blockade, would weaken the read. In PortWatch, a 30-day tanker average back above 9.97 in the November data while Brent stays above 100 would mean the route explains less. It was 9.43 on October 25 and 9.79 over the last 14 days. If Brent falls toward the July level near 85 while Bab el-Mandeb counts stay near 8 a day, the price link fails.
The Brent quote itself needs care. CappNotes reported a Brent settle of 115.32 on October 28 and attributed oil's rise to Yemen fighting and fears of renewed US strikes on Iran. Our futures_curve shows December at 113.88 and January at 109.41 on October 27, a 4.47 spread. Our live commodity_prices snapshot at 05:23 UTC on October 29 shows Brent at 110.12, down 4.51 percent on the day. That may reflect a roll from December to January, and the data cannot confirm it. A roll would lower the continuous series for reasons unrelated to shipping.
Frequently asked questions
How many tankers cross Bab el-Mandeb now?
PortWatch counts averaged 8.56 tankers a day from August 1 to October 25, against 14.29 from March to June and 11.78 before March. The 30-day average was 9.43 on October 25.
Why do Suez tanker counts not show the drop?
Suez tankers averaged 16.13 a day from August 1 to October 25 against 16.53 from March to June. Lloyd's reports Saudi crude rerouted north through Suez, so the northern exit stayed busy while the southern one thinned.
Does this explain Brent's rise to 113.88?
Probably not on this evidence. The weekly correlation since March is 0.10, most of Brent's rise came after the tanker drop, and Hormuz incidents, macro news and roll mechanics are rival explanations.
Is this a record low for tanker traffic?
We make no record claim. Our window covers 17 months from June 2025, and the 2023 to 2024 Houthi campaign years are outside it. Inside the window, all 75 30-day averages since August 12 are below the lowest earlier reading, 9.97.
What is the next data point?
Lloyd's Hormuz Brief on November 5 and its next fortnightly Red Sea Brief, plus PortWatch's November counts. The CFTC report for October 27 also arrives on Friday, October 30.
Sources
Red Sea Brief: 1 October 2026 (Lloyd's List Intelligence): blockade from 20 July, Yanbu halt in the week of 13 September, weekly Bab el-Mandeb and Suez crude counts.
Red Sea Brief: 15 October 2026 (Lloyd's List Intelligence): Bab el-Mandeb transits 16 percent below the tanker-driven peak, Suez gains in crude.
Strait of Hormuz Brief: 22 October 2026 (Lloyd's List Intelligence): at least 104 non-Iranian-linked transits October 5 to 11, at least 28 incidents in the first half of October.
Closing Look, Wednesday October 28 (CappNotes): Brent and WTI settles and the stated drivers.
Week in Focus 26 to 30 October 2026 (Newsquawk): the hot September PPI flag.
Kresmion commodities page: our own tables, chokepoint_transits (PortWatch counts), futures_prices, futures_curve and commodity_prices (data to 2026-10-25, queried 2026-10-29).