By Kresmion Research, October 30, 2026
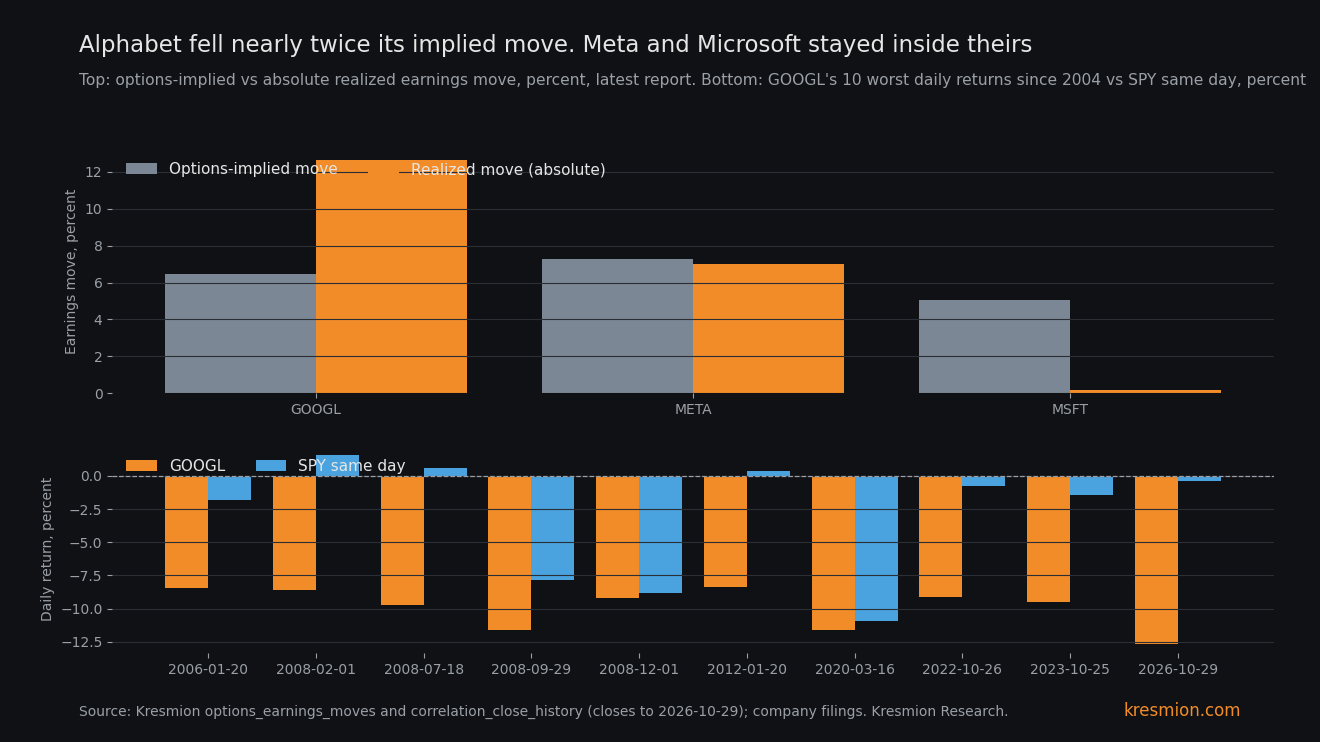
Alphabet's Class A shares fell 12.64 percent on Thursday, their worst session since 2004, against a 6.48 percent move priced by options after earnings. The stock closed at 283.82 on October 29, down from 324.89, while the S&P 500 fund SPY fell only 0.38 percent. The filings from the three hyperscalers that reported in this cycle show one difference: how much of each company's operating cash its capital spending used. Microsoft used 68 percent and still bought back stock. Meta used 104 percent (106 percent with finance-lease principal added) and bought back none. Alphabet used 121 percent, posted a second straight quarter of negative free cash flow, bought back nothing and sold stock and bonds. With three companies this is a ranking, and we do not treat it as a law.
Key takeaways
| What | Number |
|---|---|
| GOOGL close, October 29 | 283.82, minus 12.64 percent from 324.89. Worst of 5,584 daily returns from 2004-08-20 to 2026-10-29 (Kresmion correlation_close_history). Next worst: minus 11.63 on 2020-03-16 |
| Versus options | Implied move 6.48 percent, realized minus 12.64, a ratio of 1.95. The 6.48 is to a 2-day expiry, so the one-day ratio is somewhat higher (Kresmion options_earnings_moves) |
| Versus the market | GOOGL minus SPY was minus 12.26 points, rank 1 of 5,584. SPY fell 0.38 percent, 772.31 to 769.36 |
| Capex as a share of operating cash | Microsoft 68 percent, Meta 104 percent, Alphabet 121 percent (purchases of property and equipment over operating cash flow; Meta's figure is 106 percent if finance-lease principal is added, and Microsoft's release gives no finance-lease figure) (company releases) |
| Alphabet free cash flow | Minus 9.07 billion dollars in Q3 and minus 5.86 billion in Q2. No buybacks, 12.4 billion of stock sold, 28.7 billion of senior notes (Alphabet release) |
| Volume | 138,462,344 Class A shares, the highest of 1,052 sessions since 2022-08-01 and 5.3 times the 26.07 million average of 2026-07-29 to 2026-10-28 |
| Dealer gamma | Plus 218M on October 28, minus 393M on October 29, the lowest of 93 snapshots since 2026-06-27 (modeled) |
What the data shows
Alphabet's Class A shares closed at 283.82 on Thursday October 29, against 324.89 the day before. We found the same close in three Kresmion tables, which share one upstream feed and so count as a single check. Public.com's after-hours page (https://public.com/stocks/googl/after-hours) gives the same Thursday close of 283.82, but it lists the prior close as 325.61, so it does not confirm the 12.64 percent (against 325.61 the fall would be 12.83 percent). Our closes come from a late snapshot and can differ from official closes by a few cents. Our price history has 5,584 daily returns with no gap longer than five calendar days, and this is the worst of them. The next worst were minus 11.63 percent on 2020-03-16, minus 11.61 on 2008-09-29 and minus 9.77 on 2008-07-18. Only 14 days in the history fell 8 percent or more. The full-history daily standard deviation is 1.94 percent, so the fall was about 6.5 standard deviations.
It was specific to the stock. Of Alphabet's ten worst days, three came when SPY fell more than 7.8 percent (2008-09-29, 2008-12-01 and 2020-03-16). This one came on a minus 0.38 percent SPY day. Net of SPY, the fall is also the worst in the history, at minus 12.26 points against minus 10.39 for 2008-07-18.
The loss was about 505 billion dollars at the Class A price, using 12,294 million shares outstanding at 2026-09-30. That is our approximation, because it applies the Class A price to every share class and Class C trades at a slightly different price. Volume was 5.3 times its three-month average. On the same day QQQ fell 1.42 percent, the Nasdaq Composite 1.38, communication services (XLC) 1.87 and technology (XLK) 1.18, while IWM rose 0.97 and health care (XLV) rose 2.40. The data does not show what drove those moves.
At 6:00 PM ET on October 29 the stock was quoted at 281.92 after hours, minus 0.67 percent from the close (Public.com). We have no regular-session quote for Friday October 30: our latest equity rows are dated October 29.
The mechanism
The reading we test is that the market is pricing how much of the AI capital bill each company's own operating cash covers. Below 100 percent, a company's operating cash covers the build and it can still buy back shares. Above 100 percent, operating cash alone does not cover it, so the company either draws down its cash pile or raises money.
Alphabet's Q3 revenue was 127,577 million dollars, up from 102,346 million. Operating cash flow was 42,290 million, down from 48,414 million. Purchases of property and equipment were 51,355 million, up from 23,953 million, or 121 percent of operating cash. Free cash flow was minus 9,065 million, after minus 5,855 million in Q2. Repurchases were zero, against 11,504 million a year earlier. The company issued 12,371 million of stock in the quarter (12 million Class A shares for 4.3 billion and 24 million Class C shares for 8.1 billion under its at-the-market program) and 28.7 billion of senior notes. Long-term debt was 125,102 million, against 46,547 million at 2025-12-31 (Alphabet release).
Over nine months the company went from 39.8 billion of buybacks in 2025 to 42.9 billion of proceeds from common stock issuance in 2026, a swing of about 82.7 billion dollars. The release also shows 19.1 billion of mandatory convertible preferred issued in the nine months and 17.4 billion of net payments related to stock-based awards, which this swing leaves out. The swing is about 2.4 percent of the roughly 3.49 trillion dollar post-drop value, our arithmetic; it sets a flow against a market value, which makes it a weak comparison and no valuation measure. PPC Land, a secondary source built from the release, reports 27.6 billion of at-the-market capacity left and notes that Alphabet's 195 to 205 billion 2026 capex range dates from July, with no update in the release.
The ranking across the three reports matches cash coverage. Microsoft's additions to property and equipment were 39,367 million against 58,000 million of operating cash (68 percent), and it repurchased 4,379 million of stock. It closed down 0.16 percent against a 5.04 percent implied move. Meta's purchases of property and equipment were 33.94 billion against 32.79 billion of operating cash (about 104 percent, or 106 percent with 0.96 billion of finance-lease principal added), with no Class A repurchases in Q3. Microsoft's release gives no finance-lease figure, so its 68 percent could be understated. It fell 6.98 percent on October 22 against a 7.26 percent implied move. Alphabet fell 1.95 times its implied move.
A second-order point: the damage stayed inside the market. SPY fell 0.38 percent, and the rest of the session's winners (IWM, XLV) suggest money moved within equities. Amazon fell 4.25 percent on October 29, from 254.60 to 243.79, before its own report, so some read-across was in the price before its numbers.
Dealer gamma does not explain the gap. GOOGL gamma was plus 218M on October 28 with spot 324.89 above the 313.17 zero-gamma level, and Public.com shows the stock at 292.50 after hours on October 28, about 10 percent below the 324.89 close, before the regular session. The data cannot say whether hedging added to the further fall of about 3 percent during the October 29 session. The reading of minus 393M at that close, with spot 9.5 percent below the 313.50 zero-gamma level, describes the hedging setup now.
Other explanations
The earnings headline. Net income fell to about 26.2 billion dollars from 35.0 billion, but operating income rose 30 percent to 40.6 billion, revenue rose 25 percent and Google Cloud revenue doubled (Alphabet release). The fall in net income came from equity securities, which swung from a 10.7 billion dollar gain a year earlier to an 8.7 billion loss. We did not retrieve analyst estimates, so we cannot say how the results compared with expectations or how much of the move came from the headline numbers versus cash flow.
Slower core advertising. Advertising revenue grew 10.6 percent (PPC Land) while costs grew faster. That would produce a selloff even with positive free cash flow, and we cannot rule it out.
Rotation out of mega-cap tech. Equal weight (RSP, plus 1.20 percent per CappNotes; RSP is not in our database), IWM and health care rose the same day. Against this, Meta rose 1.96 percent and Microsoft was flat, so the exit was not uniform.
Options and dealer hedging. It does not explain the overnight gap, for the timing reason above, and we cannot rule it out for the session that followed.
Chance. Three companies can line up in the same rank order as their cash coverage by chance 1 time in 6.
The base rate
On price, the record is measured against Alphabet's own full listing history with no filter, so selection does not weaken it. On implied moves, our options_earnings_moves table holds 58 completed events with an implied move (55 tickers, 2026-07-16 to 2026-10-29). In it, 43.1 percent moved more than implied, the median ratio of realized to implied is 0.93, and the 90th percentile is 1.99. Nine of the 58, counting Alphabet, are at or above Alphabet's ratio of 1.95, and 10.3 percent (6 of 58) are at or above 2.0. ServiceNow moved 26.95 percent against 10.65 implied the same night, 2.53 times. So Alphabet's miss is large but not unique, and the window is only about 3.5 months, which makes this base rate thin.
The sources are less independent than they look. The three company filings are separate primary documents. Implied move and dealer gamma both come from the same option chains, and price and volume come from the same session, so we do not call the match convergence. The cross-company ranking does suffer from selection: we chose the companies because they reported in this cycle. We ran roughly 40 looks in building this note, and they include the 58-event universe, so the nine-of-58 base rate is exploratory. We did not query short interest, insider trades after October 28, congressional trades or full S&P breadth.
The evidence against
Meta is the strongest counterpoint. Its capex also exceeded operating cash, it also bought back nothing and its long-term debt rose to 80,922 million from 58,744 million, yet it fell 6.98 percent, inside its implied move. On October 29 it rose 1.96 percent, on the day Alphabet fell. Negative free cash flow alone did not produce an outsized move. What separated Alphabet may include the size of the gap (minus 9.07 billion against minus 2.12 billion), the active share sales and the earnings results, and the data cannot say how much each one contributed.
Microsoft cuts the other way. Its free cash flow fell 27 percent on the year (18,633 million from 25,663 million) and the stock was flat. That fits the coverage reading, and it also shows the market tolerating much lower free cash flow while coverage stays under 100 percent.
Alphabet was not short of cash. It held 265.1 billion dollars of cash and marketable securities against 125.1 billion of long-term debt, and it raised more than its free cash flow gap. The market may be reacting to the financing choice and the capex path, not to a cash shortfall.
Forward capex messaging is a further difference between the three. CappNotes says Microsoft pointed to a lower capex commitment and that Alphabet held its 2026 capex guidance at 195 to 205 billion dollars. Meta's release narrowed its 2026 range, which includes finance-lease principal, to 135 to 145 billion. The cash-coverage ranking is therefore confounded by what each company said about its capex plans.
What would change the read
Amazon reported after Thursday's close with trailing 12-month free cash flow of minus 42.4 billion dollars, against minus 7.6 billion a quarter earlier, and capex of about 220 billion for 2026 (Kotak Neo). Options priced an 8.04 percent move for Friday. The stock fell as much as 7 percent after hours from a close of 243.79. Kotak Neo gives Amazon's Q3 capex as 77.26 billion, about 20 billion above LSEG expectations, but no operating cash flow, so we could not build its capex-to-operating-cash ratio. A Friday close inside 8.04 percent would weaken the ranking, and a close beyond it would support it. Friday also brings the Employment Cost Index at 8:30 AM ET and Chicago PMI at 9:45 AM ET (CappNotes).
At Alphabet, the next 10-Q or 8-K will show whether at-the-market sales continue or buybacks resume, and a return to buybacks removes the net-issuer channel. The 195 to 205 billion capex guidance implies 63 to 73 billion of Q4 capex. Q4 free cash flow would be positive only if operating cash flow exceeded that, against 52.4 billion in Q4 2025 and 42.3 billion in Q3 2026. Q4 results usually arrive in early February, our assumption from past timing. A GOOGL close above the 313.50 zero-gamma level would end the negative-gamma setup. At the October 29 close it was 283.82.
Frequently asked questions
Was this really Alphabet's worst day since it listed?
In our price history, yes. The 12.64 percent fall is the worst of 5,584 daily returns from 2004-08-20 to 2026-10-29, ahead of minus 11.63 percent on 2020-03-16.
How big was the miss against options?
Options priced a 6.48 percent move, and the stock fell 12.64 percent, 1.95 times as much. The implied figure is to a 2-day expiry, so the true one-day ratio is somewhat higher. Nine of 58 completed events since 2026-07-16, counting Alphabet, had a ratio at or above Alphabet's 1.95.
Why does capex as a share of operating cash matter?
Above 100 percent, operating cash does not cover the spending, so a company draws on cash or raises money. Alphabet raised about 41.1 billion dollars in the quarter (12.4 billion of shares and 28.7 billion of notes) while holding 265.1 billion of cash and marketable securities, up from 126.8 billion at the end of 2025. The data cannot show that this caused the fall, and with three companies the match is a ranking.
Did options hedging cause the fall?
Not the gap. Dealer gamma was plus 218M before the report and most of the fall came after hours. After the fall it was minus 393M, which describes the setup now.
What is the next test?
Amazon's Friday October 30 session, against an 8.04 percent implied move. It is the first company outside the original three.
Sources
Alphabet, Third Quarter 2026 Results, October 28, 2026: operating cash flow, capex, free cash flow, zero buybacks, stock issuance, notes, long-term debt.
Meta, Third Quarter 2026 Results, October 21, 2026: operating cash flow 32.79 billion, purchases of property and equipment 33.94 billion (34.91 billion with finance-lease principal), no repurchases, debt, 2026 capex range.
Microsoft, FY27 Q1 results, October 28, 2026: operating cash flow, property and equipment additions, buybacks.
PPC Land, Alphabet's free cash flow drops to negative $9.1bn: capex guidance, share count, advertising growth, remaining at-the-market capacity (secondary, built from the release).
Kotak Neo, Amazon shares fall as AI spending overshadows AWS growth: Amazon trailing free cash flow and after-hours move.
Public.com, Alphabet after-hours: regular close 283.82 and after-hours 281.92 at 6:00 PM ET on October 29.
CappNotes, Closing Look, Thursday October 29: RSP move, Friday's calendar, Microsoft capex comment and Alphabet guidance held.
Kresmion tables: correlation_close_history (closes to 2026-10-29), options_earnings_moves, options_gamma_exposure, company_price_snapshots, company_shares.