
By Kresmion Research, November 20, 2026
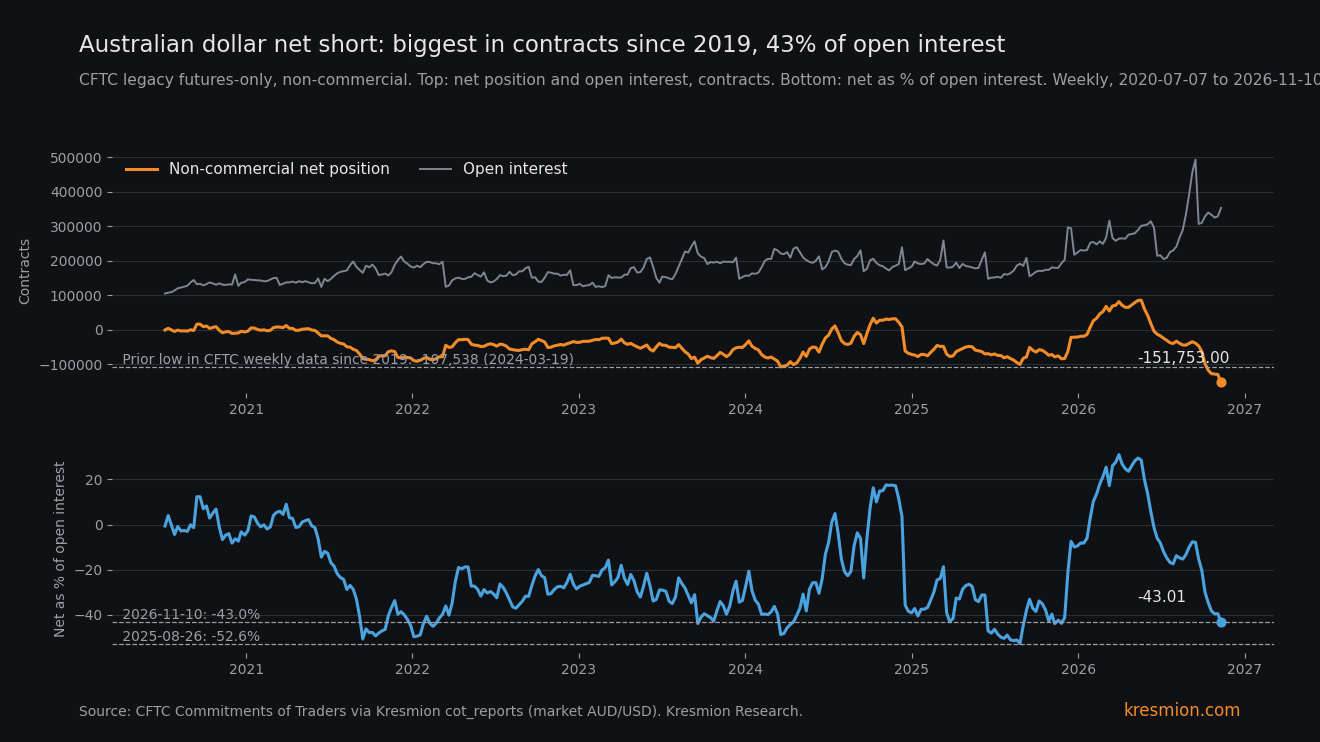
Speculators hold their largest Australian dollar net short in contracts since at least 2019, but against open interest the 2025 position was more lopsided. In the CFTC legacy futures-only report for Tuesday November 10, speculators (CFTC non-commercial traders) were net short 151,753 contracts, 43.0% of open interest. The contract count partly reflects a bigger market: open interest is 88% above its 2025 average, and longs still hold 27.9% of it. The build is recent and mostly on the short side, and holders pay carry to keep it. The CFTC report for Tuesday November 17 comes out today at 3:30 p.m. ET, so this note describes positions from before that release.
Key takeaways
| What | Number |
|---|---|
| Net position, November 10 | -151,753 contracts: long 98,447, short 250,200, open interest 352,859 (CFTC legacy futures-only, via Kresmion cot_reports) |
| Contracts | Rank 1 of 332 weeks in our table (July 7, 2020 to November 10, 2026). The previous low in the CFTC weekly file from January 8, 2019 was -107,538 on March 19, 2024 |
| Share of open interest | -43.0%. 36 of 332 weeks in our table were more negative (rank 37). The low is -52.6% on August 26, 2025 |
| Market size | Open interest 352,859 is 88% above the 2025 average of 187,846. Longs hold 27.9% of open interest, against 15.0% on August 26, 2025 |
| The build | From the post-roll week of September 22, shorts rose 94,853 contracts and longs fell 10,086. In the latest week shorts were 88% of the net change and open interest rose 24,260 |
| Carry | Australia's policy rate 4.85%, the Fed midpoint 3.875%, a gap of about 0.98 percentage points (central_bank_rates, observation month 2026-11) |
| Price | AUDUSD 0.6666 at 05:14 UTC on November 20 (forex_rates), 8.1% below the 2026 high row of 0.7255 on May 14 (correlation_close_history) |
What the data shows
The CFTC publishes the Commitments of Traders report for positions held on the Tuesday before. The report for Tuesday November 10 entered our table on November 16 at 21:20 UTC. The CFTC's 2026 schedule lists November releases on the 6th, 16th (holiday-delayed), 20th and 30th (holiday-delayed), all at 3:30 p.m. ET (CFTC release schedule, fetched November 19).
On November 10 speculators held 98,447 long and 250,200 short contracts. A week earlier, on November 3, they held 101,093 long and 230,550 short, a net short of 129,457 on open interest of 328,599. In the latest week longs fell 2,646 and shorts rose 19,650, so the net moved by 22,296 contracts and shorts were 88.1% of that change. Open interest rose 24,260.
The net short has deepened in each of the eight reports since September 15: -38,906 (September 15), -46,814 (September 22), -63,239 (September 29), -98,588 (October 6), -117,299 (October 13), -127,292 (October 20), -128,315 (October 27), -129,457 (November 3) and -151,753 (November 10). The September quarterly roll cut open interest from 493,141 on September 15 to 306,488 on September 22, which distorts any comparison across it. We therefore measure the build from September 22, when speculators held 108,533 long and 155,347 short. Since then shorts are up 94,853 and longs down 10,086. Commercial traders were net long 138,651 on November 10 (long 220,557, short 81,906), up from 112,683 a week earlier.
The claim we can support is "largest since at least 2019 in full weekly data, and above every sampled week since 1987". We do not call it a record. Our table starts in July 2020. We re-derived the CFTC's own weekly file in full from January 8, 2019 to October 13, 2026, and the previous low there was -107,538. Before 2019 we checked only a sample: about 250 weeks spread across 1987 to 2026 in the CFTC history tool, fewer than that before 2019. Weekly coverage is complete from January 8, 2019. The largest sampled net short was -90,840 (March 12, 2024), and the largest before 2019 was -76,779 (August 6, 2013). Our table matches the CFTC file on overlapping weeks (-117,299 on October 13 and -63,239 on September 29). Both are the same CFTC source, so that checks our data pipeline and is not independent confirmation.
The mechanism
The Australian dollar is the most liquid G10 stand-in for global growth, China and commodity demand, and for Asian equity risk. A channel that would fit: the US rate path is priced higher and equities are falling, so funds add Australian dollar shorts as a hedge or as a trend position. We did not test this for the September to November build. Fed official Paulson said the Fed has more tightening to do, and a J.P. Morgan headline on the same page says it now sees three straight hikes (both per investingLive on November 20; we read the headline only). Neither is a Fed decision. QQQ closed 2.19% lower on November 19 after being up 2.06% at 10:04 a.m. ET (Stock Titan). All of these are dated after the November 10 report, so they describe the setting the position now sits in and cannot explain that week's build.
The positioning data fits a fresh build. Between September 22 and November 10 shorts rose 94,853 contracts while longs fell 10,086, so shorts account for about 90% of the net change, and open interest rose from 306,488 to 352,859, which fits new short positions. Legacy non-commercial data cannot separate new positions from covering and re-opening, so that split is not established.
Two implications are less obvious. First, the contract count is flattered by market growth. Open interest is 88% above its 2025 average, and longs hold 27.9% of it against 15.0% at the August 2025 extreme. At -43.0% of open interest the week ranks 37th of 332. Applied to the August 26, 2025 open interest of 191,207, today's ratio would be about -82,238 contracts, well inside the CFTC file's earlier range, which reached -107,538. Applied the other way, the 2025 ratio of -52.6% on today's open interest would be about -185,639.
Second, the short costs money to hold. Our central_bank_rates table has Australia at 4.85% and the Fed range midpoint at 3.875%, a gap of about 0.98 percentage points a year, which in our reading a short pays through the futures discount. The position now costs that carry. That fits hedging, or a bet that the gap narrows, through US hikes or a softer Australian labour market. Australian unemployment rose to 4.9% on November 19 and AUDUSD fell 0.89% to 0.6657 that day, with the US dollar strongest against the Australian dollar among the majors (investingLive). For Australia and the US the table holds only 2026-11, so we cannot say what the gap was while the position was built; the Fed's target upper bound has been 4.00% since September 17 (FRED DFEDTARU). The data cannot say which motive dominates or how large the price effect of this positioning is.
Other explanations
Market growth. Most of the contract record may come from open interest of 352,859 against a 2025 average of 187,846. The non-commercial group may also hold more spread and relative-value accounts than before, and the legacy report cannot separate them. On the open-interest measure the position ranks 37th.
Hedging. Funds may short the Australian dollar as a liquid proxy hedge for Asian chip and equity exposure or for copper and China risk. We have no data on the accounts' other holdings, and the Asian equity moves (November 20) and the copper drop (November 18) came after the November 10 report date, so they cannot explain this position. If so, the short tracks equity risk and the Australian-specific view could be small.
Rate-path repricing. Fed hike forecasts narrow the Australian carry advantage from the US side and the 4.9% unemployment rate narrows it from the Australian side. The Fed's actual hike on September 17, to a 4.00% upper bound (FRED DFEDTARU), predates the build. The Paulson comment, the J.P. Morgan call and the unemployment print all came after the report date.
Trend following. AUDUSD is 8.1% below its 2026 high row, and systematic trend models add shorts as prices fall. In that case positioning follows price.
Roll artifact. We rule it out for this week: November 10 is not a quarterly expiry week and open interest rose.
The base rate
In our table the net short of 151,753 is rank 1 of 332 weeks, with no week lower. Rank 1 here is a selected maximum. We screened all 20 markets in our cot_reports table on two measures (net contracts and net as a share of open interest), plus the long and short split, which is roughly 40 or more comparisons, and Australia was picked because it was the most extreme in contracts. We cannot re-run that screen from the data we hold. The second measure was not used to select it, so we report it as the fairer test: -43.0% of open interest has 36 of 332 weeks more negative, about the 11th percentile, against a minimum of -52.6% on August 26, 2025. In the CFTC file the share reached -50.6% on September 14, 2021 and -48.7% on March 19, 2024. The short share of open interest, 70.9%, is the highest in our table (the previous high was 70.6% on October 27, 2026).
Price context is middling. The AUDUSD row for November 20 (0.66538) has 581 of 1,271 rows lower since January 3, 2022. The 7-row change to that row is -3.14%, and 31 of 1,264 seven-row windows since 2022 were as weak or weaker. That figure carries a caveat: the daily rows appear to hold about the prior session's close, and the November 20 row is a partial day.
The yen leg is context only. Speculators were net long 123,113 yen contracts (+31.7% of open interest) on November 10, below April 2025's +179,212. The AUDUSD price, our regime engine's AUDJPY input (z-score -2.32 on November 19, with the engine at Strong Risk-Off) and the yen long all describe one dollar, funding and risk theme, so we make no convergence claim.
The evidence against
The strongest point against a "crowded one-way short" reading is the denominator. At -43.0% of open interest the position is shallower than -52.6% on August 26, 2025 and -50.6% on September 14, 2021. Longs still hold 98,447 contracts, 27.9% of open interest against 15.0% in August 2025. The AUDUSD level is unremarkable too, with 581 of 1,271 rows since 2022 lower. And against our carry point, for Australia and the US central_bank_rates holds a single month, so the rate gap's change over the build is not visible.
What would change the read
The CFTC report for Tuesday November 17 comes out today, Friday November 20, at 3:30 p.m. ET. The build would be reversed if the net short is back above -117,299 (the October 13 level), or if shorts fall while open interest falls, which would be covering. If net as a share of open interest goes below -52.6%, the position becomes extreme on both measures. The next release is Monday November 30 (holiday-delayed), covering November 24.
Read the December reports with care. The September roll cut open interest from 493,141 to 306,488 in one week, which mechanically swings the share of open interest. The CFTC has also announced twice-weekly COT publication by the end of 2026, with Monday data on Wednesday and Wednesday data on Friday (CFTC press release 9316-26), which will change week-to-week comparability. We did not verify other calendar events for this note. AUDUSD was 0.6666 at 05:14 UTC on November 20.
Frequently asked questions
Is the Australian dollar short a record?
Not on our evidence. In contracts, 151,753 is the largest since at least 2019: it is above every week of the CFTC weekly file from January 8, 2019 and above every sampled week back to 1987. Before 2019 we checked only a sample of weeks, not every week. As a share of open interest, -43.0% ranks 37th of 332 weeks in our table.
How lopsided is the position?
Speculators hold 250,200 short and 98,447 long contracts, so longs are 27.9% of open interest. That compares with 15.0% on August 26, 2025, when the net short reached -52.6% of open interest.
Why would speculators short a currency with a higher interest rate?
Our table has Australia at 4.85% and the Fed midpoint at 3.875%, so a short pays about 0.98 percentage points a year in carry. Hedging, trend following and a bet that the rate gap narrows would each fit.
Does the position say where the Australian dollar goes next?
We did not test whether this positioning has led later AUDUSD moves, and we do not call a direction.
When is the next data point?
The CFTC report for Tuesday November 17 is out today at 3:30 p.m. ET. The next one is Monday November 30, for November 24.
Sources
CFTC, Commitments of Traders release schedule: releases at 3:30 p.m. ET, with November releases on the 6th, 16th, 20th and 30th (fetched November 19, 2026). Report-date data for AUD/USD (code 232741) comes from Kresmion cot_reports and the CFTC weekly file.
CFTC, press release 9316-26: plan for twice-weekly publication of the COT report by the end of 2026.
investingLive, Americas FX news wrap, November 19: AUDUSD down 0.89% to 0.6657 after Australian unemployment rose to 4.9%.
investingLive, Asia-Pacific market news, November 20: Nikkei, KOSPI and futures moves, AUD near 0.6660, the RBA's Fry-McKibbin giving no steer, and the Paulson and J.P. Morgan comments.
Stock Titan, stock market today, November 19, 2026: QQQ closed 2.19% lower after being up 2.06% at 10:04 a.m. ET.
SEC, Form 4 for Berkshire Hathaway and Sirius XM Holdings, period October 30, 2026: the filing behind one of today's follow-up posts.