
By Kresmion Research, November 19, 2026
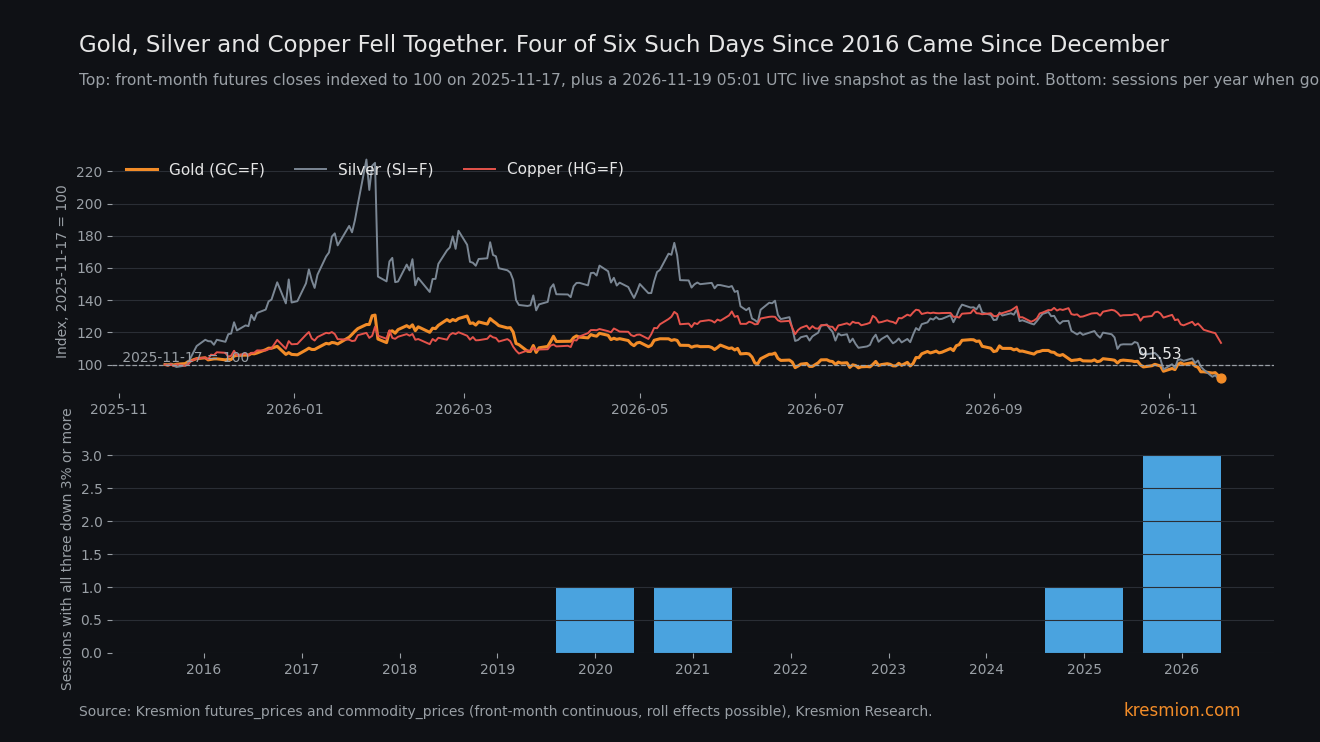
Gold, silver and copper fell together on Wednesday, the day of the hawkish Fed minutes, and such falls have bunched up over the past year in our futures data. In our futures history, all three fell 3% or more on the same day only 6 times in 2,608 sessions since July 2016, and 4 of those 6 came between December 29, 2025 and June 24, 2026. The dollar index rose 0.32% on Wednesday and Kitco has the 10-year yield easing, so neither fully accounts for a fall this size on the evidence we hold, and Reuters describes computer-driven selling in copper alongside worries about inflation and a firm dollar. CFTC data to November 10 shows no crowded long in gold or silver. Wednesday figures are daily closes from our live commodity snapshot, read at 05:12 UTC Thursday, because our futures table ends November 17.
Key takeaways
| What | Number |
|---|---|
| Wednesday close vs Tuesday settle | Gold -3.16% to 3,741.90, silver -4.84% to 44.999, copper -5.30% to 5.6595 (Kresmion commodities snapshot of daily closes, read 05:12 UTC Thursday) |
| Same-day falls of 3% or more in all three, July 19, 2016 to November 17, 2026 | 6 of 2,608 sessions. 4 of the 6 fall between December 29, 2025 and June 24, 2026 (Kresmion futures_prices) |
| Distance from highs | Gold 29.64% below its January 29 close of 5,318.40, silver 60.90% below its January 26 close of 115.08, copper 16.81% below its September 9 close (Kresmion futures_prices and commodities snapshot) |
| Yield and dollar on Wednesday | 10-year down about 3.6 bp to 5.065% (Kitco). Dollar index 103.82, up 0.32%, highest since April 2025 (Kresmion correlation_close_history) |
| Dollar test | On 462 days since 2016 with a dollar index gain of 0.20% to 0.45%, GLD fell 3.27% or more on 5 (1.1%), against 0.7% of all days. Since December 1, 2025, it did on 2 of 48 such days (4.2%) (Kresmion correlation_close_history) |
| CFTC positioning, November 10 | Copper speculator net long 28,904 contracts, down 68.7% from 92,476 on September 8. Gold net long 190,107 at the 36th percentile of 173 weeks. Silver 19,364 at the 7th (CFTC via Kresmion cot_reports) |
What the data shows
Gold front-month futures settled at 3,864.20 on Tuesday, November 17, and closed at 3,741.90 on Wednesday, down 3.16%. Silver went from 47.288 to 44.999 (-4.84%) and copper from 5.976 to 5.6595 (-5.30%). Our futures_prices table ends November 17, so the Wednesday closes come from our live commodity snapshot of yfinance daily closes, read at 05:12 UTC Thursday. Over five sessions from the November 11 close, gold fell 6.46%, silver 13.26% and copper 9.80%. Outside reports agree on direction and size. Kitco's PM report has spot gold down 125.90, or 3.27%, to about 3,722.60 and silver down 4.95% to about 44.93. Reuters has Comex copper down 3.8% to 5.76 dollars a pound, a seven-month low, and LME three-month copper down 3.5% to 12,770 dollars a ton by 1100 GMT, its lowest since April 13.
On closing levels, gold's Wednesday close is its lowest since September 25, 2025 and silver's is its lowest since the same date. Copper's is its lowest since April 7, 2026. From their one-year closing highs, gold is 29.64% lower, silver 60.90% and copper 16.81%.
The mechanism
The minutes came out at 2 p.m. ET, after most of the move. LME copper was already down 3.7% at 9:13 a.m. London time and December gold was down 92.80, about 2.4%, by 4:25 a.m. Central (Price Futures Group, citing Bloomberg), and the dollar had been rising ahead of the release. So the minutes can only explain the last part of the fall. Kitco says nearly all officials anticipated a December hike, two raised the possibility of a 50 bp hike, and the market priced about a 95% probability of a 25 bp hike at the December 8 to 9 meeting. The dollar index closed at 103.82, its highest since April 1, 2025, and all three metals are priced in dollars. Every news source we cite names the dollar, inflation or rate worries among the drivers.
The rate channel does not work on Wednesday. The textbook link is that higher real yields raise the cost of holding gold. Kitco has the 10-year yield down about 3.6 bp to 5.065%, and the FRED 10-year breakeven went from 2.21 to 2.19. FRED's 10-year yield (5.10) and real yield (2.89) have no November 18 row yet, so the yield move rests on Kitco alone, an AI-assisted newswire. Since the breakeven equals the nominal yield minus the real yield, a 2 bp fall in the breakeven and a 3.6 bp fall in the nominal yield imply the real yield fell by a small amount, roughly 1 to 3 bp given that FRED rounds the breakeven to 0.01, which would normally support gold.
The dollar channel fits the direction, and the size test below is weaker than it looks. The dollar index gained 0.32%. On the 462 days since 2016 with a gain of 0.20% to 0.45%, GLD averaged -0.38%, its 5th percentile was -1.98%, and it fell 3.27% or more on 5 (1.1%), against 0.7% of all days (19 of 2,733). But gold futures' daily standard deviation is 1.77% since December 1, 2025 against 0.95% before, and in that period GLD fell 3.27% or more on 2 of 48 such dollar days (4.2%). The older history therefore understates what a dollar move of this size can do now, and the data cannot say how large the dollar's part of Wednesday's fall was. We used 3.27% because it matches Kitco's spot gold move. The join of dollar and GLD dates can misalign by a few days around weekends.
That leaves selling across the metals complex, on top of whatever the dollar contributed. Reuters reports speculative, computer-driven selling in copper after a break of support levels, and also cites worries over rising inflation and a buoyant dollar. It does not describe gold or silver, so extending that reading to the other two metals is our inference. China's October industrial production came in at +4.8% against a 5.3% forecast, and ten-month fixed-asset investment at -8.1% against a -7.0% forecast (Price Futures Group). Gold and silver were falling into the week, with silver 13.26% lower over the five sessions to Wednesday's close.
The second-order implication is about hedging. Kitco's report also describes US-Iran escalation, including attacks on Gulf bases and a tanker strike, and gold still traded with silver and copper. Joint 3% falls were absent from 2016 to 2019 and from 2022 to 2024, and 4 have come since December 2025. That fits more common cross-metal selling this year, but gold volatility also roughly doubled over the same months (daily standard deviation 1.77% against 0.95%), and the dollar index rose on all six earlier joint-fall days. The data cannot separate these explanations.
Other explanations
A plain repricing of Fed policy. The minutes moved a December hike close to certain, and one macro shock hit three dollar-priced metals. Against it: Kitco has yields falling and the dollar move was modest. For it: the dollar index is at its highest since April 2025, and Reuters cites an "inflation scare".
Separate stories that landed on one day. Copper had China data misses, AI data-centre demand doubts and, per Price Futures Group, an easing Shanghai squeeze. Gold and silver had a downtrend since January. Against it: all three fell in one session, and the pattern has appeared 4 times in 11 months.
Crowded longs unwinding. We test it in the evidence section. The CFTC data through November 10 shows no crowded long in gold or silver, but the legacy report does not separate index funds, Asian exchanges or ETFs.
A measurement artifact. Front-month continuous futures can carry roll effects. Kitco's spot figures and Reuters' midday Comex figure independently put all three below -3% on the session.
The base rate
Window: front-month continuous futures for GC=F, SI=F and HG=F, July 19, 2016 to November 17, 2026, 2,608 sessions with all three present. All three fell 3% or more on 6 sessions (0.23%): March 18, 2020, June 17, 2021, December 29, 2025, January 30, 2026, June 5, 2026 and June 24, 2026. By year that is zero in 2016 to 2019 and 2022 to 2024, one each in 2020, 2021 and 2025, and three in 2026 before Wednesday. Wednesday's closes (gold -3.16%, silver -4.84%, copper -5.30%) all clear the 3% line, so Wednesday is the 7th such day since 2016 and the 5th since December 2025. We will not call it unprecedented.
On the six earlier days the 10-year yield changed +16, -5, -2, +2, +8 and -9 bp, so it fell on 3 of 6. The dollar index rose on all six, from +0.02% to +1.59%, and rose 0.20% or less on two of them. Falling yields alongside a joint metals fall are not new.
The 3% line is a round number we picked after seeing Wednesday, so the clustering could look different at other thresholds. Gold's volatility also roughly doubled after December 2025 (daily standard deviation 1.77% against 0.95% before), which by itself would bunch up large falls. Alone, gold fell 3.27% or more on 20 of the 2,608 days and copper 3.8% or more on 32.
The dollar index at 103.82 is a level reached before: it closed at or above that on 456 of 2,542 closes since November 18, 2016, about 18%, and last did on April 1, 2025. About 20 to 25 distinct comparisons were looked at across our desks this month, so a one-in-400-day reading appearing by chance is not negligible. The case rests on the repeated clustering across 2025 and 2026. Our prices and the dollar series likely share one upstream vendor, so they do not count as independent confirmation.
The evidence against
Positioning in gold and silver is the strongest point against a liquidation reading. In the CFTC report for November 10, gold speculators held a net long of 190,107 contracts, 47.0% of open interest. That sits at the 36th percentile of 173 weeks since July 2023 in contracts and the 52nd on share of open interest, below the 243,334 of August 25. Silver's net long of 19,364 (16.7% of open interest) sits at the 7th percentile. Copper's net long was already down 68.7%, from 92,476 on September 8 to 68,520 on October 13 and 28,904 on November 10, 9.2% of open interest of 314,115. Longs fell by 45,765 and shorts rose by 17,807, from 37,024 to 54,831. Copper's net long of 28,904 sits at about the 48th percentile of the same 173 weeks (35th on share of open interest), so it is a normal level for the period even after the 68.7% cut from the September high. Noncommercial longs still stood at 83,735 contracts, so some of Wednesday's selling could have come from them, from new shorts or from participants the report does not separate. The report is eight days old and the metals fell hard in between.
The joint-fall days also do not need lower yields: on 3 of the 6 earlier days the 10-year rose, by 16 bp on March 18, 2020. So "yields fell, metals fell anyway" is less special than it looks, and a plain dollar and Fed repricing remains possible.
What would change the read
Thursday, November 19, 8:30 a.m. ET: US jobless claims and the Philadelphia Fed survey (Kitco). Soft data that pulls yields lower while metals keep falling would strengthen the non-rate reading. A metals rebound with a weaker dollar would point back to the Fed and dollar channel.
Friday, November 20: the CFTC report for Tuesday, November 17. Sharp falls in gold or silver net longs, or copper shorts above 54,831, would support momentum selling.
Our futures table adding November 18: if its settlements differ from the closes we used, the Wednesday figures change. FRED's 10-year yield and real yield for November 18: a rise in the real yield despite the nominal dip Kitco reports would bring back the rate channel, which the breakeven move, rounded to 0.01, makes unlikely. The dollar index back below 103 before the December 8 to 9 FOMC with no metals recovery would weaken the dollar explanation.
On November 10 the copper speculative net long was 28,904 contracts, down from 92,476 on September 8.
Frequently asked questions
Did gold, silver and copper really all fall more than 3% on Wednesday?
Yes on our closes: gold -3.16%, silver -4.84% and copper -5.30% from Tuesday's settle to Wednesday's close (Kresmion commodities snapshot of daily closes, read 05:12 UTC Thursday). Kitco's spot figures (gold -3.27%, silver -4.95%) and Reuters' midday Comex copper (-3.8%) agree. Our futures_prices table ends November 17.
How often do all three metals fall this much on one day?
In our futures history since July 19, 2016, all three fell 3% or more on the same day 6 times in 2,608 sessions. 4 of the 6 came between December 29, 2025 and June 24, 2026.
Why did metals fall when Kitco has the 10-year yield easing?
Kitco has the 10-year down about 3.6 bp to 5.065%, and the 10-year breakeven moved from 2.21 to 2.19. The dollar index gained 0.32% to its highest since April 2025. On 462 earlier days with a similar gain GLD fell 3.27% or more on 5, but gold's volatility has roughly doubled since December 2025, so that history understates what the dollar can do now. Reuters describes computer-driven selling in copper alongside worries about inflation and a firm dollar.
Was this a crowded long being unwound?
CFTC data to November 10 shows no crowded long in gold or silver. Gold's speculative net long was at the 36th percentile of 173 weeks and silver's at the 7th. Copper's was down 68.7% since September 8 but still near the 48th percentile of the same weeks. The report omits some participant types, and the next one is due Friday.
Sources
Kitco PM Report, November 18, 2026: spot gold and silver moves, 10-year and 2-year yields, dollar index 103.82, December hike odds, minutes, WTI and Brent settles (AI-assisted newswire).
Reuters via Business Recorder, November 18, 2026: LME and Comex copper moves, computer-driven selling after a break of support levels.
Price Futures Group, Manic Metals Report, November 18, 2026: China October industrial production and fixed-asset investment, Shanghai copper squeeze (broker blog).
Bloomberg via Yahoo Finance, November 18, 2026: early Asia copper move and the AI and China framing.
CFTC, Commitments of Traders: legacy futures-only non-commercial positions in gold, silver and copper, report date November 10, 2026.
Kresmion commodities page: live metals data and our futures history.
Kresmion Research note, November 19, 2026: this note.