
By Kresmion Research, November 6, 2026
The two-year Treasury yield fell 11.45 basis points to 4.4665 percent on Thursday as the S&P 500 lost 4.36 percent, its worst session since 2025-04-04. That comparison uses our S&P 500 series, which starts 2022-01-04. The Federal Reserve raised its target range to 3.75 to 4.00 percent on 2026-09-16 (effective 2026-09-17 in FRED) and held at its 2026-10-27 to 28 meeting, so the move came in a hiking phase. We set it against the 45 days since 2000 when SPY, the S&P 500 ETF, fell 4 percent or more: the two-year yield fell on 32 of them. A basis point (bp) is one hundredth of a percentage point. This is one event seen in several series, so we do not treat the pieces as independent confirmation. The investingLive wrap describes the selloff as led by AI and chip suppliers, with Micron down about 12 percent in the session; we have not tested that attribution.
Key takeaways
| What | Number |
|---|---|
| S&P 500, Thursday 2026-11-05 | 7,353.73, down 4.36 percent from 7,688.62. Worst session since 2025-04-04 (minus 5.97 percent) in a series that starts 2022-01-04 (Kresmion correlation_close_history, ^GSPC) |
| Treasury yields, 2026-11-05 | 2Y 4.4665 percent (down 11.45 bp), 5Y 4.6098 (down 7.82), 10Y 4.8408 (down 5.12), 30Y 5.2581 (down 2.19) (investingLive wrap) |
| Curve | FRED T10Y2Y, 10-year minus 2-year, 0.32 on 2026-11-04 and 0.38 on 2026-11-05, a 6 bp steepening (Kresmion fred_series_history) |
| Base rate since 2000 | SPY fell 4 percent or more on 45 days. The 2Y fell on 32, the median change across all 45 days was minus 6 bp, and 9 days had falls bigger than 11.45 bp (SPY joined to FRED DGS2, to 2026-11-04) |
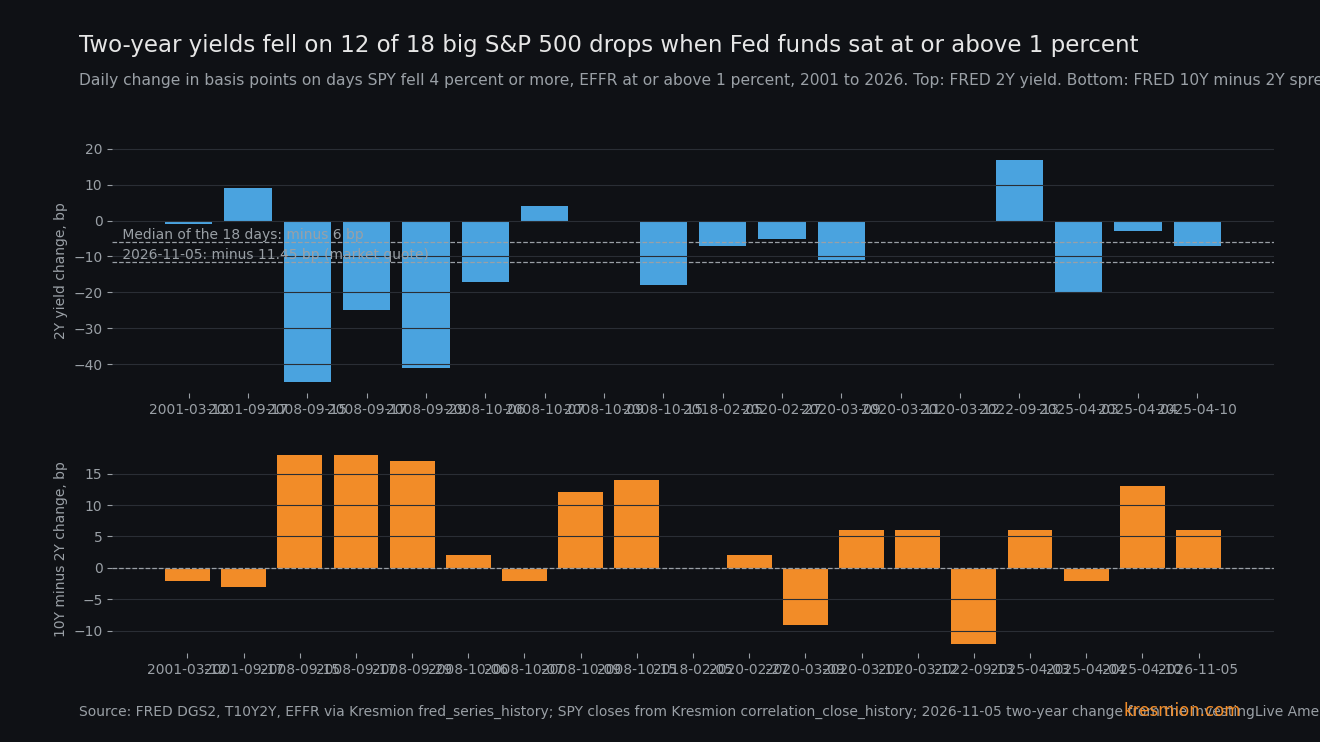
| Split by fed funds rate | With the effective fed funds rate (EFFR) at or above 1 percent: 18 days, 2Y fell on 12, median minus 6 bp, curve steepened on 11 (median plus 4 bp). Below 1 percent: 26 days, curve median minus 7 bp. The 1 percent threshold was chosen after the fact |
| Hike-phase precedents | n = 4 big drops after a Fed hike: 2Y minus 13 bp (2000-04-14), minus 7 (2018-02-05), minus 3 (2022-05-18), plus 17 (2022-09-13). The curve steepened on one of the four |
| Against | The 2Y fell 12 bp from 2026-10-27 to 2026-11-04 (4.70 to 4.58, FRED DGS2). The S&P 500 ended that window down 0.44 percent but was down 2.35 percent on 2026-11-02 |
What the data shows
The S&P 500 closed at 7,353.73 on Thursday 2026-11-05, down 4.36 percent from 7,688.62 (Kresmion correlation_close_history, symbol ^GSPC, closes through 2026-11-05). 2025-04-03 was minus 4.84 percent, and 2025-04-04 minus 5.97 percent. The investingLive Americas wrap, which we fetched, has the S&P 500 down 4.35 percent at 7,353.85, the Dow down 1,833.16 points (3.44 percent) at 51,528.16, and the Nasdaq 100 down 6.36 percent in its headline. Yahoo Finance's live page showed the VIX at 28.18, up 69.66 percent. Our 2026-11-05 note covers the AI and data-center selloff that came before.
The same wrap has the 2Y at 4.4665 percent, down 11.45 bp, with the 5Y down 7.82 bp, the 10Y down 5.12 bp and the 30Y down 2.19 bp. FRED's own two-year yield for 2026-11-05 is not loaded yet, so the 2Y level rests on one market-quote source. The steepening shows in a separate official series: FRED's T10Y2Y rose from 0.32 to 0.38, steeper by 6 bp. The wrap's 10Y of 4.8408 is also consistent with the 4.8370 in Yahoo's header.
The Fed raised its target range to 3.75 to 4.00 percent on 2026-09-16 (effective 2026-09-17 in FRED), its first change since a cut on 2025-12-11 (FRED DFEDTARU and DFEDTARL). The FOMC met on 2026-10-27 to 28 and the range did not change. A TradingKey commentary page says the Fed paused its hikes in October and that markets were still betting on a December hike. The Fed's own 2026-10-28 statement held the range on a 10 to 2 vote, with Cook and Hammack dissenting in favor of a quarter-point hike (https://www.federalreserve.gov/newsevents/pressreleases/monetary20261028a.htm). The TradingKey page is one commentary source, and fed funds futures are covered under other explanations. Weekly jobless claims came in at 189K against an estimate of 196K, a data point that on its own would push yields up.
The mechanism
The two-year yield is the maturity most tied to where markets think the Fed's rate will sit over the next two years. A 4.36 percent equity drop tightens financial conditions without any help from the Fed, and in our reading it lowers the chance the Fed needs to hike again. The front end reprices the most: the 2Y fell 11.45 bp, the 10Y 5.12 bp and the 30Y 2.19 bp.
Long yields also carry compensation for holding bonds for decades and for inflation risk. Oil rose on Thursday (WTI settled at 90.52, up 2.72 percent, per the investingLive wrap) and the Bank of England voted 8 to 1 to raise rates to 4 percent on 2026-11-05, its first hike since 2023 (Yahoo Finance), which would fit a smaller move in the long end. But 10-year breakevens fell 2 bp (2.26 to 2.24), and we did not test this. The curve ended 6 bp steeper.
That pattern resembles crash days when the Fed was easing or had room to cut. With EFFR at or above 1 percent, the curve steepened on 11 of 18 days, but six of those 11 fall in September to October 2008 and three in early 2020. The hike-phase days did not steepen on three of four. It does not resemble the crash days near zero rates, when the curve flattened by a median 7 bp.
The second-order point is about hedging in a hiking phase. Whether Treasuries cushion stocks may depend on what causes the shock; our four cases cannot show that. Thursday's front-end move looks like a hedge against a risk shock. The long end gave little cushion on the day: the 30Y fell 2.19 bp on a 4.36 percent equity drop. We did not query the price of long-bond funds such as TLT.
Other explanations
Flight to cash. In a sell-off, money moves into bills and short notes as a cash substitute, whatever the Fed view. Our fed_funds_futures table (CME 30-day contracts) ends at 2026-11-04, so it does not include Thursday and cannot separate hike-odds repricing from safe-haven demand on the day. It does show the path moving before the crash: the implied average rate for June 2027 (100 minus the futures price) fell from 4.545 percent on 2026-10-27 to 4.405 percent on 2026-11-04, and for December 2026 from 4.045 to 4.025, against an effective funds rate of 3.88. The graded move by maturity (11.45, 7.82, 5.12, 2.19 bp) fits a policy-path repricing better than a uniform haven bid, since a haven bid tends to hit the 10Y hard too.
Oil and inflation repricing carrying on. Brent's January 2027 contract fell 16.6 percent from 2026-10-30 to 2026-11-04, and 10-year breakevens (T10YIE, the inflation rate implied by Treasuries) fell from 2.35 on 2026-10-27 to 2.26 on 2026-11-04. Thursday could be momentum in that trend. Against it, oil rose on Thursday and breakevens fell only 2 bp, from 2.26 to 2.24.
Positioning. Speculators held a net short of 981,538 contracts in 10Y note futures on open interest of 5,881,588 (CFTC report for 2026-10-27, against 964,293 on 2026-10-20), and covering would push yields down. The 10Y fell less than half as much as the 2Y, and much of that short is likely a cash-futures basis trade that the legacy report cannot split out. We did not check 2Y futures positioning.
A data surprise. This does not explain the move: lower jobless claims would push yields up. The wrap also reports third-quarter productivity of 3.6 percent against 2.8 expected, and we did not test which way that moved yields. Other Thursday confounders in the wrap, including midterm results, Wednesday's oil plunge on Iran war hopes and Fed speakers Barkin and Hammack backing gradual hikes, are not tested here.
The base rate
Window: 2000-01-04 to 2026-11-04. We joined SPY closes (correlation_close_history) to FRED DGS2, T10Y2Y and EFFR (fred_series_history). SPY fell 4 percent or more on 45 days. The direction is common: the 2Y fell on 32 of the 45 days (71 percent). The size is in the upper fifth: the median change across all 45 days was minus 6 bp, and 9 days (20 percent) had falls bigger than Thursday's 11.45 bp, the deepest being minus 45, minus 41 and minus 25 bp in 2008 and minus 20 bp on 2025-04-03. For a day of any kind, FRED's 2Y fell 12 bp or more on 160 of 6,714 sessions since 2000-01-03 (2.4 percent).
The curve result needs care. In the full sample the median change in T10Y2Y on these days is minus 2 bp. The steepening appears after splitting on EFFR. With EFFR at or above 1 percent there are 18 days: the 2Y fell on 12 (median minus 6 bp) and the curve steepened on 11 (median plus 4 bp). With EFFR below 1 percent there are 26 days (2000-04-14 has no EFFR row, so the two groups cover 44 of the 45), the 2Y median is minus 5.5 bp and the curve median is minus 7 bp. We chose the 1 percent threshold after seeing that near-zero-rate days flatten, and we ran about 8 cuts within this angle, so treat the split as a description of the sample. A 6 bp steepening with a falling 2Y happened on 7 of the 45 days: five in autumn 2008 and two in April 2025.
The data has a vendor quirk. SPY shows minus 4.38 percent on 2025-04-10 while ^GSPC in the same table shows minus 3.46 percent. Removing that day leaves a 2Y fall on 31 of 44.
The hike-phase subset is four days, counting drops that followed a Fed hike: 2000-04-14 (2Y minus 13 bp, curve plus 4), 2018-02-05 (minus 7, curve unchanged), 2022-05-18 (minus 3, curve minus 6) and 2022-09-13 (plus 17, curve minus 12). The 2000 date is identified from monthly FEDFUNDS, which rose from 5.45 in January to 6.27 in May 2000, because FRED's target series starts in 2008. The 2Y fell on three of four, but the curve steepened on only one, so Thursday's steepening is unlike its closest regime analogues. The last was the release day of the August 2022 CPI, when headline prices were up 8.3 percent over 12 months, down from 8.5 percent in July, and core was up 6.3 percent (BLS). We did not retrieve the consensus, so we cannot say the print surprised, but stocks fell while the 2Y yield rose 17 bp that day. Four cases are not a rate.
On the level of the 2Y against policy: DGS2 minus EFFR was 70 bp on 2026-11-04, at or above that on 1,363 of 6,582 days since 2000-07-03. After Thursday's fall the 2Y sat about 59 bp above the 3.88 percent EFFR (market quote against the FRED EFFR of 2026-11-04), at or above that on 1,788 of those days (27 percent), against a median of 28 bp. The drop trimmed the premium above current policy and left it in place.
The evidence against
The front end was falling before the crash. FRED's 2Y went from 4.70 on 2026-10-27 to 4.58 on 2026-11-04, a 12 bp fall. The S&P 500 ended that window 0.44 percent lower, from 7,722.60 to 7,688.62, but it was 2.35 percent lower on 2026-11-02 at 7,541.40, and the 2Y reached 4.56 on 2026-10-30, so the earlier fall was not free of equity weakness. Over 2026-10-30 to 2026-11-04 Brent's January contract fell 16.6 percent, from 113.43 to 94.62, and 10-year breakevens fell 9 bp over 2026-10-27 to 2026-11-04 (2.35 to 2.26). The 2Y fell about as much in the six sessions before Thursday as on the crash day itself. The equity shock is therefore one of at least two channels, and the data cannot say how much of Thursday's 11.45 bp belongs to each. The FOMC hold on 2026-10-28 sits inside that window as a third candidate. Fed funds futures show the same drift before Thursday: the June 2027 contract's implied rate fell 14 bp from 2026-10-27 to 2026-11-04, so part of the front-end move was a policy-path repricing that was already under way.
A front end priced above current policy also remains. A hot inflation print could reverse the move.
What would change the read
1. FRED's DGS2 for 2026-11-05, when loaded. A print near 4.47 means the wrap's move holds; a print at or above 4.52 would suggest the wrap overstated it. Both thresholds are our own judgment, and we have no base rate for the usual gap between the wrap quote and the H.15 print. 2. October payrolls today, Friday 2026-11-06 at 08:30 ET. Consensus is 59,000 (Kiplinger) to about 65,000 (TradingKey), with unemployment at 4.2 percent. We had not retrieved the result when we wrote this. A strong print that lifts the 2Y back above 4.58 would reverse Thursday's repricing. 3. The 2Y minus EFFR spread, 70 bp on 2026-11-04. A move toward its 28 bp median since 2000 would mean the front end has priced out further tightening. 4. PPI on Friday 2026-11-13, and the FOMC on 2026-12-08 to 09. 5. October CPI on Tuesday 2026-11-10 at 08:30 ET. If stocks fall and the 2Y rises on the same day, as on 2022-09-13, the read that the front end hedges equity shocks in this hiking phase fails.
Frequently asked questions
Did Treasury yields normally fall on big stock drops?
Since 2000, SPY fell 4 percent or more on 45 days to 2026-11-04, and FRED's 2Y yield fell on 32 of them, with a median change across all 45 days of minus 6 bp.
Why did the curve steepen when the Fed was hiking?
The 2Y fell 11.45 bp while the 10Y fell 5.12 bp, so the 10-year minus 2-year spread widened by 6 bp on FRED's T10Y2Y. Our untested reading is that the front end priced less Fed tightening after the equity drop. We did not establish why the long end fell less: 10-year breakevens fell 2 bp (2.26 to 2.24), so inflation compensation does not obviously explain it. With fed funds at or above 1 percent the curve steepened on 11 of 18 such days, a split we chose after the fact.
Does a Treasury hedge work in a hiking phase?
It may depend on the shock. In our data four big drops followed a Fed hike: the 2Y fell on three and rose 17 bp on 2022-09-13, the August 2022 CPI day, and the curve steepened on only one of the four.
Is the 11.45 bp fall confirmed?
Partly. The 2Y level comes from one market-quote source, the investingLive wrap, because FRED's 2Y for 2026-11-05 is not loaded. The 6 bp steepening is confirmed by FRED's T10Y2Y.
What is the next test?
October payrolls today at 08:30 ET, then October CPI on Tuesday 2026-11-10 at 08:30 ET.
Sources
investingLive Americas FX news wrap 5 Nov: Nasdaq 100 plunges 6.36% as AI selloff spreads: 2Y, 5Y, 10Y and 30Y yields and changes, claims of 189K against 196K, S&P 500 and Dow closes.
Yahoo Finance, Stock market today, Thursday November 5: Bank of England 8 to 1 hike to 4 percent, VIX 28.18, 10Y header 4.8370.
TradingKey, US NFP Preview: October employment: the Fed paused hikes in October, a December hike still bet on, payroll consensus.
Federal Reserve, FOMC meeting calendars: 2026-10-27 to 28 and 2026-12-08 to 09 meetings.
Federal Reserve, FOMC statement of 2026-10-28: range held at 3-3/4 to 4 percent on a 10 to 2 vote.
BLS, Schedule of Selected Releases 2026: jobs report 2026-11-06, CPI 2026-11-10, PPI 2026-11-13, all at 08:30 ET.
BLS, Consumer Price Index, August 2022: released 2022-09-13, prices up 8.3 percent over 12 months.
Kiplinger, What to Expect From the October Jobs Report: consensus of 59,000 payrolls and 4.2 percent unemployment.
Kresmion note, 2026-11-05: context on the AI and data-center selloff that preceded Thursday.