
By Kresmion Research, November 12, 2026
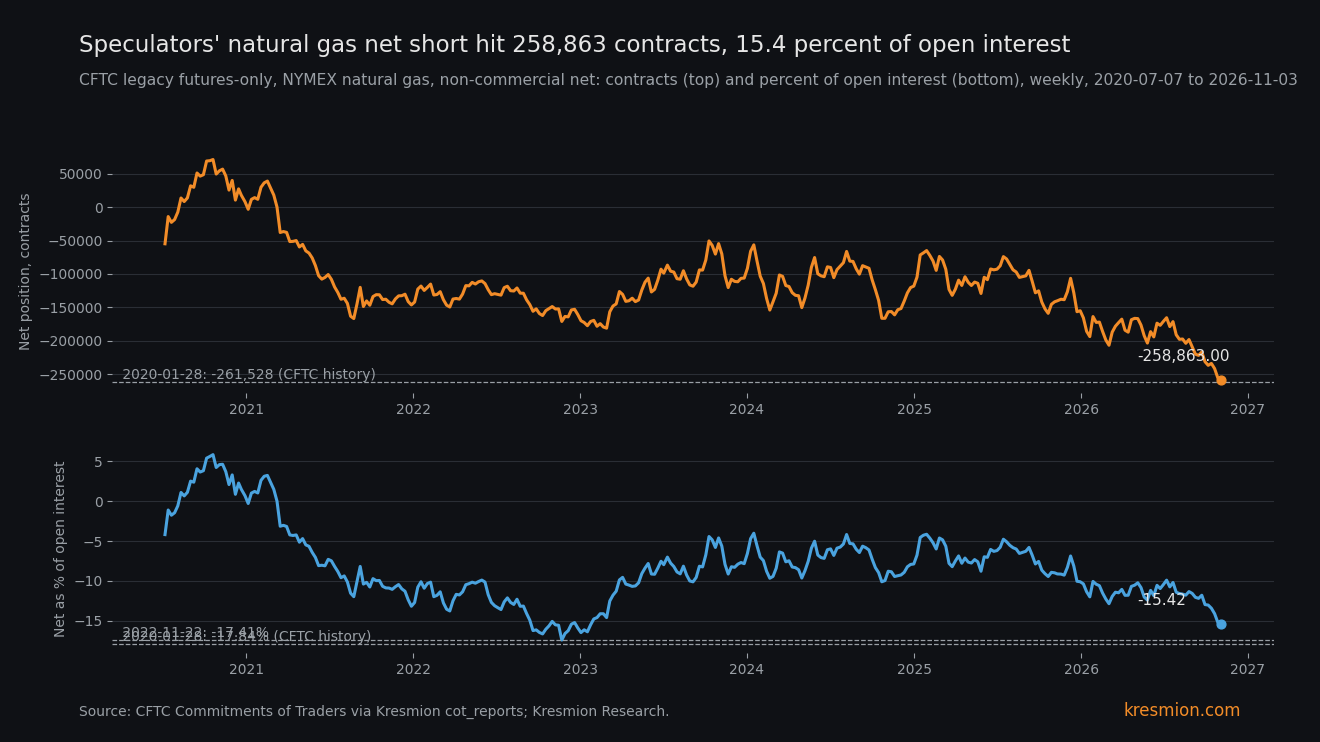
Speculators hold their largest natural gas net short since January 2020, 258,863 contracts, and the December contract then rose 13.85 percent in five sessions. The figures come from the CFTC legacy futures-only report for Tuesday November 3, in which non-commercial traders (the group usually called speculators) on NYMEX Henry Hub were net short 258,863 contracts. That is the deepest of the 331 weeks in our cot_reports table, which starts July 7, 2020. It is 2,665 contracts short of the 261,528 reached on January 28, 2020, so it is not a record. The futures market has grown, and as a share of open interest 16 earlier weeks in our table were deeper, with 14 more in CFTC history from 2019 to 2020. We make no forecast.
Key takeaways
| What | Number |
|---|---|
| Net position, November 3 | -258,863 contracts: long 279,879, short 538,742, open interest 1,678,554. Prior week -255,164 (cot_reports) |
| Rank | 1 of 331 weeks since July 7, 2020; the median net over that window is -122,564. In CFTC weekly history checked week by week from June 2019, only January 28, 2020 was deeper, at -261,528 (cftc_history); before 2019 we checked a thin sample only |
| Share of open interest | -15.42 percent. 17 of 331 weeks are at or below it; the 16 earlier ones in our table all fall between September 20, 2022 and January 24, 2023, the deepest -17.41 percent on November 22, 2022. CFTC history adds 14 more deeper weeks between August 13, 2019 and March 3, 2020 |
| How it was built, October 13 to November 3 | Shorts +27,836, longs +2,551, net deepened by 25,285 (cot_reports) |
| December contract (NGZ26) | 3.602 on October 13, 2.895 on November 3 (-19.63 percent), 3.296 on November 10 (+13.85 percent). NG=F, whose front is the December contract, read 3.270 USD/MMBtu at 04:57 UTC on November 12 (futures_curve, commodity_prices) |
| Storage, week ending October 30 | 3,801 Bcf, 1.05 percent above our week-matched five-year average of 3,761.4 and 2.66 percent below a year earlier (eia_inventories) |
What the data shows
The CFTC publishes its Commitments of Traders report on Fridays for positions held the Tuesday before. Our cot_reports table has data to November 3, our futures_curve table to November 10, and our EIA storage table to the week ending October 30. In the November 3 report, non-commercial longs were 279,879 and shorts 538,742, a net short of 258,863 on 1,678,554 contracts of open interest. The week before it was 255,164, so the latest weekly change is 3,699 contracts.
The last leg was new selling. From October 13 to November 3 shorts rose 27,836 (510,906 to 538,742) and longs rose only 2,551 (277,328 to 279,879). Over the same three weeks the December 2026 Henry Hub contract fell from 3.602 to 2.895, down 19.63 percent. Its closes on the way were 3.022 on October 26, 3.004 on October 27 and 2.856 on November 2, the low of the window we pulled.
The longer build looks different. From September 22 to November 3 the net short deepened by 42,333 contracts, but most of that, 26,483 contracts or 62.6 percent of the change, came from longs leaving. Shorts added 15,850, and open interest fell from 1,837,146 to 1,678,554.
After the measurement date the December contract rose from 2.895 to 3.218 on November 9 and 3.296 on November 10, up 13.85 percent. NG=F read 3.270 at 04:57 UTC on November 12, 12.95 percent above the November 3 close of the December contract. Most of the net short, 233,578 contracts, was already in place on October 13, when the December contract was 3.602, and the contract did not close below 3.305 from September 16 to that date, so those shorts were opened above today's 3.296. Of the 25,285 added since, 7,694 came in the week to October 20, with closes from 3.301 to 3.559, also above 3.296. Only the 17,591 added after October 20 came at closes below today's, from 3.182 down to 2.856. The data cannot say which traders added or cut.
The mechanism
Storage did not argue for a glut. Lower 48 working gas was 3,801 Bcf on October 30 against our week-matched 2021 to 2025 average of 3,761.4, a gap of 1.05 percent, inside a five-year range of 3,580 to 3,931. A week earlier, on October 23, it was 3,724 against 3,725.4. A year earlier it was 3,905. The five-year average is our own, matched by ISO week, which can sit up to six days later in the calendar, so our average is probably a little high. It may also differ from EIA's published figure.
Shorts added into a falling price, with inventories near normal, fits selling that follows price. The report does not identify trading styles, so the data cannot say whether trend-following funds, spread traders or hedgers did the selling. Selling that follows price does not need a surplus to explain it. It also has a second-order consequence. A short opened at 2.895 on November 3 was underwater at 3.296 on November 10, so the November 3 report cannot say whether the late additions are still there. The data cannot say how large any price effect of the position is, in either direction.
A second consequence concerns the denominator. Open interest of 1,678,554 is 14.5 percent above the 1,465,557 of January 28, 2020. Part of the largest-in-our-table count is a bigger market, which is why we report the share of open interest below.
A third is a data trap in the price series. Continuous charts of NG=F splice contract months together. The 2.602 that NG=F showed on October 26 was the expiring November contract; the December contract closed at 3.022 that day. One of our own internal briefs cited a 26.7 percent rise from the October 26 low. That compares the expiring November contract (2.602) with the December contract (3.296). On the December contract alone the rise is 9.07 percent (3.022 to 3.296), and since September 16 the December contract is down 3.46 percent (3.414 to 3.296). On November 10 the January 2027 contract (NGF27) was 3.655, 10.89 percent above December. If that gap stays near 10.89 percent, a continuous NG=F chart would show a jump of about that size at the late-November roll with no price change. Our explainer on contango and backwardation covers why.
Other explanations
Curve positioning. The legacy report adds up all contract months. The winter-to-spring spread (January 2027 at 3.655 minus April 2027 at 2.469) was 1.186 on November 10, up from 1.007 on November 3 (3.392 and 2.385). Part of the short could be spring and summer legs held against winter longs, a curve view rather than an outright one. The legacy report cannot separate them.
Hedges outside NYMEX futures. These are futures-only figures. They exclude options and ICE Henry Hub look-alike contracts, so some shorts may hedge long options or swap exposure held elsewhere.
Market growth. A larger market produces larger counts, as the denominator section shows.
A supply view. Traders may be positioned for production or mild weather that storage does not yet show. We did not query production, LNG feedgas or weather, so we cannot test this from our data.
The base rate
Inside our window, rank 1 of 331 weeks. Only one week, the current one, has a net at or below -258,863. In CFTC weekly history, checked week by week from June 2019, the only deeper week is January 28, 2020 (-261,528, which was 17.84 percent of open interest). No week from February 4, 2020 to October 13, 2026 was deeper, and February 4, 2020 itself was -246,701. Before 2019 we checked only a thin sample of about 250 weeks. The deepest sampled count was -239,751 on February 10, 2015, but unsampled weeks could be deeper.
As a share of open interest the picture softens. The net short is -15.42 percent, and 17 of 331 weeks are at or below it, about the 5th percentile of our window. The 16 earlier ones in our table all fall between September 20, 2022 and January 24, 2023, and CFTC history adds 14 more between August 13, 2019 and March 3, 2020. The sampled pre-2019 weeks ran -26.35 percent (February 1, 2011), -26.47 percent (March 22, 2011) and -23.66 percent (February 10, 2015).
The search space matters. An internal screen covered the 20 COT markets in our cot_reports table on two measures, roughly 40 comparisons. The euro was also rank 1 of 331 and the New Zealand dollar rank 4, and we did not compute how often a 20-market scan produces a rank 1. Two markets reaching rank 1 in the same week may also point to a common positioning driver rather than independent extremes. That is why we put the share of open interest next to the count.
For price, a 13.85 percent rise in five sessions is ordinary for gas. On the continuous NG=F series, 113 of 1,274 five-row windows since November 8, 2021 (8.9 percent) rose that much or more, with a standard deviation of 11.32 percent. That series contains roll jumps and weekend copy rows, so the base rate is approximate.
On independence: the positions (CFTC), contract prices (CME data through a vendor feed) and storage (EIA) have three separate publishers. Price and positioning still move together by construction, because traders react to price, so their co-movement is not convergence. Two internal screens found this extreme separately, but from the same table, so we count them as one observation.
The evidence against
The strongest point against calling this an extreme is the denominator. At -15.42 percent of open interest, 16 weeks in our table, all in late 2022 and early 2023, were deeper, down to -17.41 percent, and CFTC history adds 14 more from 2019 to 2020. The January 2020 peak was -17.84 percent, and thin-sample CFTC weeks in 2011 and 2015 ran -23.7 to -26.5 percent. Measured against the size of the market, the short is smaller than in 2019-20, 2022-23 and the sampled 2011 and 2015 weeks, though still the 17th deepest of the 331 weeks in our table, about the deepest 5 percent.
A second point is that the latest weekly change of 3,699 contracts is small, and the snapshot predates a 13.85 percent rise in the December contract. The November 3 figure may already be stale.
What would change the read
The COT report for Tuesday November 10 is due Friday November 13, or Monday November 16 if the CFTC shifts it for the Veterans Day holiday (we have not confirmed the schedule). A net short above 261,528 would pass the January 28, 2020 level. A drop of 25,000 contracts or more with shorts falling would mean the position was cut into the rebound.
The EIA storage reports for the weeks ending November 6 and November 13 matter too. A reading well above our week-matched five-year average (3,761.4 Bcf on October 30) would give the shorts a supply rationale that is missing today.
The December contract expires in late November, and the front then moves to January, which traded at 3.655 on November 10. The December contract settled at 3.296 on November 10.
Frequently asked questions
Is this a record natural gas net short?
No. At -258,863 contracts it is the deepest of the 331 weeks in our cot_reports table, but January 28, 2020 was 2,665 contracts deeper at -261,528 in CFTC weekly history. Before 2019 we checked only a sample, and unsampled weeks could be deeper.
Why does open interest change the picture?
Open interest is 14.5 percent higher than in January 2020, so a bigger count can come from a bigger market. As a share of open interest the net short is -15.42 percent, and 16 earlier weeks in our table, all from September 20, 2022 to January 24, 2023, were deeper, and CFTC history adds 14 more between August 13, 2019 and March 3, 2020.
Did storage justify the shorts?
Not by a surplus. Lower 48 working gas was 3,801 Bcf on October 30, 1.05 percent above our week-matched five-year average of 3,761.4 and 2.66 percent below a year earlier. The shorts were added while the December contract fell 19.63 percent, which fits selling that follows price.
Is natural gas up 26.7 percent from its October 26 low?
No. The continuous NG=F series showed 2.602 that day because it was holding the expiring November contract. On the December contract alone, price is up 9.07 percent from October 26 and down 3.46 percent since September 16.
When do we learn whether the shorts were cut?
The CFTC report for November 10 is due Friday November 13, or Monday November 16 if the holiday shifts it. Storage data for the week ending November 6 is also due this week.
Sources
Kresmion, futures curve monitor: settlement of November 10, 2026 shows the December 2026 contract at 3.296, January 2027 at 3.655 and a front to next spread of +10.89 percent, matching our futures_curve table.
CFTC Public Reporting, Legacy COT dataset: origin of the weekly history for contract 023651 behind cftc_history. We did not check the dataset's contents this run, so every figure is cited to our tables.
EIA, Weekly Natural Gas Storage Report: publisher of the Lower 48 working gas series in our eia_inventories table. EIA's own five-year average was not read.
Kresmion, contango and backwardation explainer: why continuous futures series jump at a roll. Fetched during our fact-check.
Kresmion, COT positioning tool: CFTC week of November 3, 2026 shows natural gas speculators net short 258,863 contracts, -15.4 percent of open interest, matching our cot_reports table.
Kresmion, commodities page: live commodity context.