
By Kresmion Research, November 9, 2026
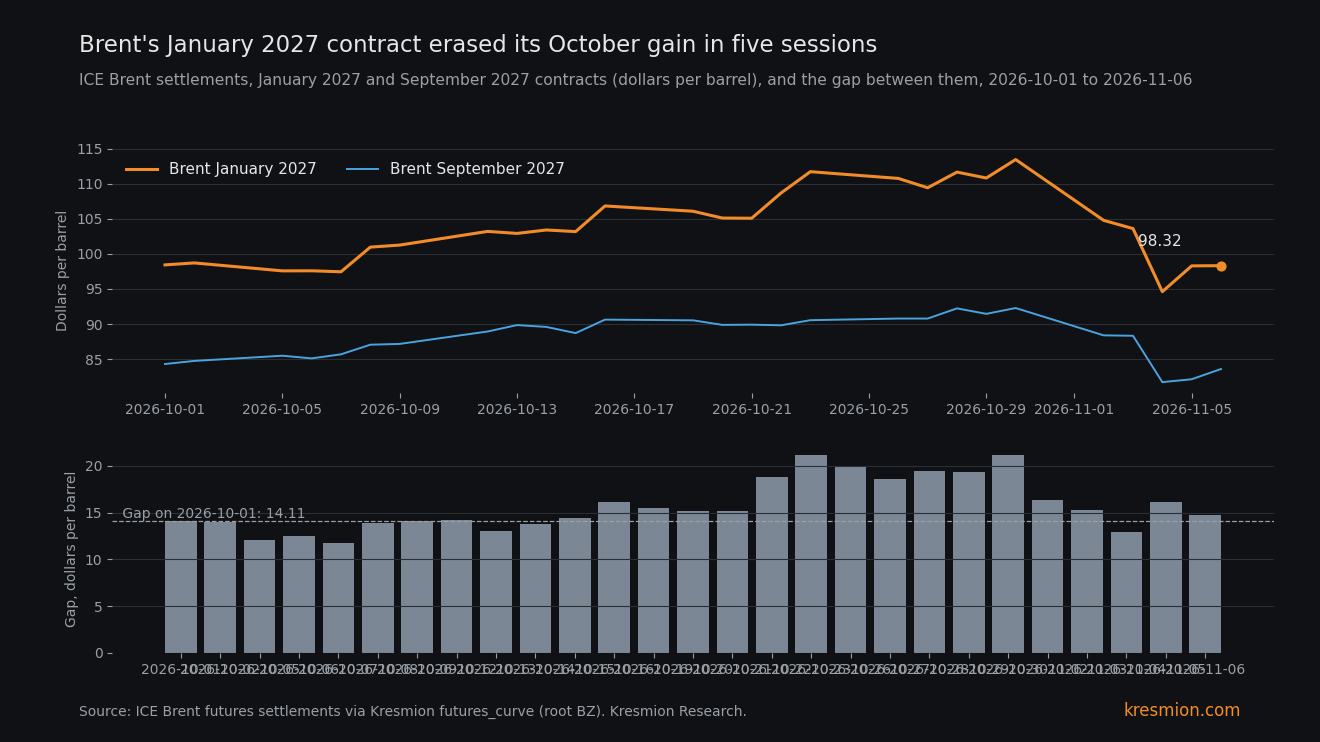
Brent's January 2027 contract lost 15.11 dollars in five sessions, wiping out October's 15.00 dollar gain, but Hormuz tankers were near zero through Nov 1. The contract (ICE settlements in our futures_curve table) went from 98.43 on October 1 to 113.43 on October 30, then to 98.32 on Friday November 6, down 13.32 percent in five sessions. The September 2027 contract fell 9.41 percent over the same days, so both the near-term premium and the level of the whole curve reversed. IMF PortWatch transits in our chokepoint_transits table show tankers crossing the Strait of Hormuz at 0.75 a day from October 1 to November 1, against 41.3 a day across 2025. The data cannot say whether the futures market or the physical market will prove right, or how large the price effect of a deal or no deal would be.
Key takeaways
| What | Number |
|---|---|
| Brent January 2027 contract (futures_curve, root BZ, expiry 202701) | 98.43 on 2026-10-01, 113.43 on 2026-10-30, 98.32 on 2026-11-06. Up 15.00 (15.24 percent) in October, down 15.11 (13.32 percent) in five sessions, ending 0.11 below its October 1 level |
| Brent September 2027 contract (expiry 202709) | 84.32, 92.29, 83.61. Up 7.97, then down 8.68 (9.41 percent), also below its October 1 level |
| Gap, January minus September 2027 | 14.11 on 2026-10-01, 21.14 on 2026-10-23 and 2026-10-30 (its peak in our window), 14.71 on 2026-11-06 |
| Hormuz tankers (chokepoint_transits, IMF PortWatch) | 0.75 a day from 2026-10-01 to 2026-11-01, 1.43 a day from March to May 2026, 41.3 a day across 2025 (table starts 2025-05-19). One vessel of any type on 2026-11-01 |
| Murban physical crude (Gulf News, Monday) | Up 3.42 percent to 99.17, about 1.70 above Brent futures |
| 10-year breakeven inflation (FRED T10YIE) | 2.34 on 2026-10-30, 2.23 on 2026-11-06, down 11 basis points. 10-year real yield (DFII10) 2.60 on both 2026-10-30 and 2026-11-05 |
| October Brent, continuous front (futures_prices, BZ=F) | The continuous front (the December contract) had 22 sessions, averaged 108.34 and never closed below 100.20. The January contract, now the front, averaged 104.73 in October (low 97.45, high 113.43) and settled at 98.32 on November 6 |
What the data shows
We compare the same contract on different dates, because the continuous front-month series jumps when it rolls. The widely quoted loss of more than 16 percent (Gulf News repeats it for the week) matches our continuous BZ=F series, which fell 16.42 percent from 117.64 on October 30 to 98.32 on November 6. Of that, 4.21 dollars is the November 2 roll from the December contract to January, which was 113.43 on October 30. Like for like, the January contract lost 13.32 percent. The Monday November 2 fall was 113.43 to 104.77, down 8.66 dollars (7.63 percent). The Wednesday November 4 fall was larger, but our table (94.62) and one outlet (93.52) disagree on that day's settlement, so we do not quote a figure for it.
The curve lets us split October's move in two. A near-term disruption premium widens the gap between the January 2027 contract and the later September 2027 contract. A change in the expected price path lifts every contract. In October both happened: the gap widened from 14.11 to 21.14 dollars and the September 2027 contract rose 7.97. By November 6 the gap was 14.71 and the September contract was 83.61, below its October 1 level of 84.32. The September contract's 8.68 dollar drop equals 57 percent of the January contract's 15.11 dollar drop, and the narrowing gap covers the rest. Every contract from January to October 2027 fell between 9.09 percent (October 2027, 90.72 to 82.47) and 13.32 percent (January 2027), and their average went from 100.43 to 89.29. WTI followed: the December 2026 contract fell 12.76 percent, from 104.12 to 90.83, and October 2027 fell 8.22 percent, from 84.27 to 77.34.
The physical lane looks different. Tankers crossed Hormuz at 0.75 a day from October 1 to November 1, which is 1.8 percent of the 41.3 a day we measure for 2025, and below the 1.43 a day of March to May 2026. The collapse is not new: the same table shows 30.06 a day in January 2026 and 39.39 in February, then 0.81 in March. Daily vessel totals from October 25 to November 1 were 2, 5, 4, 3, 3, 7, 8 and 1, with tankers at 1, 2, 0, 2, 1, 0, 4 and 1. The table has no history before 2025-05-19, so this is a level comparison. Tanker counts at Suez (16.72 a day against 16.86) and Malacca (73.16 against 72.70) were close to their March to May levels, while Bab el-Mandeb was 36.9 percent lower (9.13 against 14.47).
On Monday, Gulf News reported Brent futures at 97.49, down 0.84 percent at 9:27 am Beijing time, while Murban physical crude rose 3.28 (3.42 percent) to 99.17, about 1.70 above futures. It also reported a tanker burning after a strike in Hormuz on November 8, and cited PortWatch at one vessel transit on November 1, which matches our table. Murban at 99.17 is only about 1.7 percent above futures, and we hold no Murban history, so we cannot see how physical prices moved over the week; Monday's rise is one quote diverging from futures on one day. Business Recorder's headline the same day: "Oil falls as Trump says new Iran attacks 'unlikely'".
The mechanism
News reports tied the selloff to hopes of US and Iran de-escalation: RTE on November 6 wrote that Republican midterm losses raised those hopes alongside a stock market sell-off, and Gulf News on Monday described oil dipping on talks. Our data does not test that cause. What it shows is that traders removed both parts of October's move within five sessions, which reads as a cut in the size and in the expected length of a disruption. Our shipping table ends on November 1, before the five-session drop began, so it cannot show whether traffic recovered during the drop. Through November 1 there was no recovery, and Murban physical crude, a single quote, rose on Monday while futures fell.
The second-order trace runs into bonds. From October 30 to November 6 the 10-year breakeven inflation rate, the gap between nominal and inflation-protected yields, fell 11 basis points, from 2.34 to 2.23. From October 30 to November 5, the latest date we have for those series, the 10-year nominal yield fell 10 basis points, from 4.94 to 4.84, and the 10-year real yield was back at 2.60 on November 5, where it started. The Treasury move came through inflation compensation with real yields back where they started, which fits rates markets carrying the same deal assumption as oil futures. Breakevens also fall in a flight to nominal Treasuries, which we take up below. The windows end a day apart, and Friday's jobs report (payrolls +165,000 against a 65,000 forecast, per Reuters) falls after our nominal and real yield data.
Tuesday's October CPI (BLS, November 10, 8:30 a.m. ET) measures a month in which the continuous Brent front (the December contract) never closed below 100.20 and averaged 108.34. The January contract, the front since November 2, settled at 98.32 on November 6, 6.41 below its October average of 104.73, though part of the gap to the December contract is the December premium.
Other explanations
A demand scare from stocks. The S&P 500 fell 4.36 percent on November 5 to 7,353.73 and closed 7,376.86 on Friday, down 2.68 percent over five sessions. Copper fell 3.42 percent in five sessions. The timing fits a demand scare poorly. The S&P 500 rose 1.58 percent on Wednesday November 4, the day Brent's January contract had its largest fall, and fell 4.36 percent on Thursday November 5, when the January contract rose to 98.29. Stocks were also already lower on October 30 and November 2, so demand fear may have added to the oil drop. Our table and one outlet disagree on the November 4 settlement, so we give no figure for that day.
Speculative long liquidation. The WTI non-commercial net long (cot_reports) was 141,106 on 2026-09-22 and 74,343 on 2026-10-27, and 80,289 on 2026-11-03 (longs 324,523, shorts 244,234, open interest 1,908,732). The report covering the drop week comes out Friday, so a forced unwind cannot be ruled out yet.
Roll and data artifacts. The 16 percent headline includes the roll, which is why we use same-contract figures.
A bond-market effect without oil. Breakevens can fall when investors rush into nominal Treasuries. Real yields ended where they started, which fits an inflation channel, but a flight to nominal Treasuries can produce a similar breakeven move and the data cannot separate the two.
The base rate
Same-contract Brent data in futures_curve starts on 2026-09-28 (WTI on 2026-07-17), so we have no long-run distribution for a same-contract weekly move or for the gap. For the continuous series, five-session changes in BZ=F across 2,594 overlapping windows from 2016-07-26 to 2026-11-06 had a mean of 0.32 percent and a standard deviation of 5.81. Eighteen windows were at or below minus 16.42 percent: March 2020 (8), April 2020 (6), March 2022 (1), April 2026 (1) and November 2026 (2). That series includes roll jumps. Headlines called this the biggest weekly drop since 2020. Our continuous series shows a larger window ending April 8, 2026, but it spans a contract roll and our same-contract data start in September, so we cannot confirm or dispute that headline.
WTI's December contract did not roll in this window. Its 12.76 percent fall was matched or exceeded in 48 of 2,600 overlapping CL=F windows since 2016-07-26 (1.8 percent), spread over 17 calendar months. That count is on the continuous CL=F series, not a same-contract measure, so windows can include roll jumps. In 2026 those months are April (3), May (1), June (2) and November (2). The fall is large and not unusual for this year.
An 11 basis point five-day fall in the 10-year breakeven occurred in 359 of 5,962 windows since 2003-01-09 (6.0 percent) and 84 of 1,463 since 2021 (5.7 percent), against a standard deviation of 7.9 basis points. We ran about 10 distribution checks for this note and did not correct for that search, so the lead rests on a described round trip and a level comparison, not on rarity.
The evidence against
The gap came back to 14.71 dollars, near its early October level, but that level was set with Hormuz already close to shut: tankers averaged 1.43 a day from March to May and 0.75 a day from October 1 to November 1. The curve returned to its pre-escalation shape for October and has not returned to a no-disruption shape. A September 2027 contract at 83.61 compares with the EIA's October outlook of 84 for the 2027 average, up from 74 in September (Investing.com, forecasts completed October 1), so "the war premium is gone" overstates it. A single contract and an annual average forecast are not the same measure.
Our window is also short. The "back to October 1" comparison is two points in a six-week stretch. Murban's 3.42 percent rise is one physical quote, and Gulf News itself notes such quotes can be thin and volatile. Our own search was limited: we did not query oil options, refinery margins, OPEC output or tanker rates.
What would change the read
The EIA's Short-Term Energy Outlook is due Tuesday November 10. Its October edition had fourth-quarter 2026 Brent at 105 dollars, from 91, and a 2026 average of 96. If the new forecast holds near 105 against a 98.32 January contract, the agency and futures disagree by about 7 dollars; a cut toward 98 would mean they share a read. October CPI follows at 8:30 ET. Breakevens moving back above 2.34 would weaken the reading that rates followed oil. On Friday November 13 the CFTC report for positions as of November 10 will show whether WTI longs fell sharply from 324,523, which would point to a forced unwind. The next chokepoint update after November 1 matters most: Hormuz tanker counts above March to May's 1.43 a day would mean physical flow is following futures, and counts under 1 a day with Brent under 100 would leave the drop resting on expectations. A gap above 19 dollars without a deal announcement would mean the near-term premium is back; the gap ran 18.62 to 21.14 from October 26 to October 30. On November 6 it was 14.71.
Frequently asked questions
Did Brent fall 16 percent last week?
The continuous front-month series fell 16.42 percent, from 117.64 to 98.32, but 4.21 dollars of that is the roll from the December to the January contract. The January 2027 contract itself fell 13.32 percent, from 113.43 to 98.32.
Have tankers returned to the Strait of Hormuz?
Not in the data we hold. Tankers averaged 0.75 a day from October 1 to November 1, against 41.3 a day across 2025, and PortWatch shows one vessel of any type on November 1. The latest date in our table is November 1.
Why did breakevens and Treasury yields fall with oil?
The 10-year breakeven inflation rate fell 11 basis points, from 2.34 to 2.23, while the 10-year real yield was back at 2.60 on November 5, where it started. That fits inflation compensation following oil lower. A flight into nominal Treasuries could produce a similar breakeven move, and the data cannot fully separate the two.
Is the war premium gone from Brent?
The gap between the January and September 2027 contracts is back to 14.71 dollars, close to its October 1 level of 14.11, which was already a period of near-shut Hormuz traffic. The curve returned to its early October shape and has not returned to a no-disruption shape.
What reports come next?
October CPI and the EIA outlook on Tuesday November 10, then PPI and the CFTC positioning report on Friday November 13.
Sources
Gulf News, Oil Prices Dip Amid US-Iran Talks, But Gulf Crude Surges Over 3% (2026-11-09): Monday Brent 97.49, Murban 99.17, tanker strike on November 8, PortWatch one transit on November 1.
RTE, Brent oil prices set for biggest weekly drop since 2020 (2026-11-06): reported link between midterm losses, a stock market sell-off and de-escalation hopes.
Business Recorder, Oil falls as Trump says new Iran attacks 'unlikely' (2026-11-09): Monday headline.
Investing.com via Yahoo, EIA raises Q4 oil price forecast to $105 (2026-10-07): October STEO Brent forecasts.
EIA, Short-Term Energy Outlook data browser: next release November 10, 2026.
BLS, CPI home: October 2026 CPI scheduled for November 10 at 8:30 a.m. ET.
Reuters via Yahoo Finance, Strong October jobs report (2026-11-06): payrolls +165,000 against a 65,000 forecast.
FXEmpire, The Week Ahead: CPI and Tech Earnings Test a Fragile Stock Market (2026-11-07): CPI and PPI dates, FOMC December 8 to 9.