
By Kresmion Research, November 13, 2026
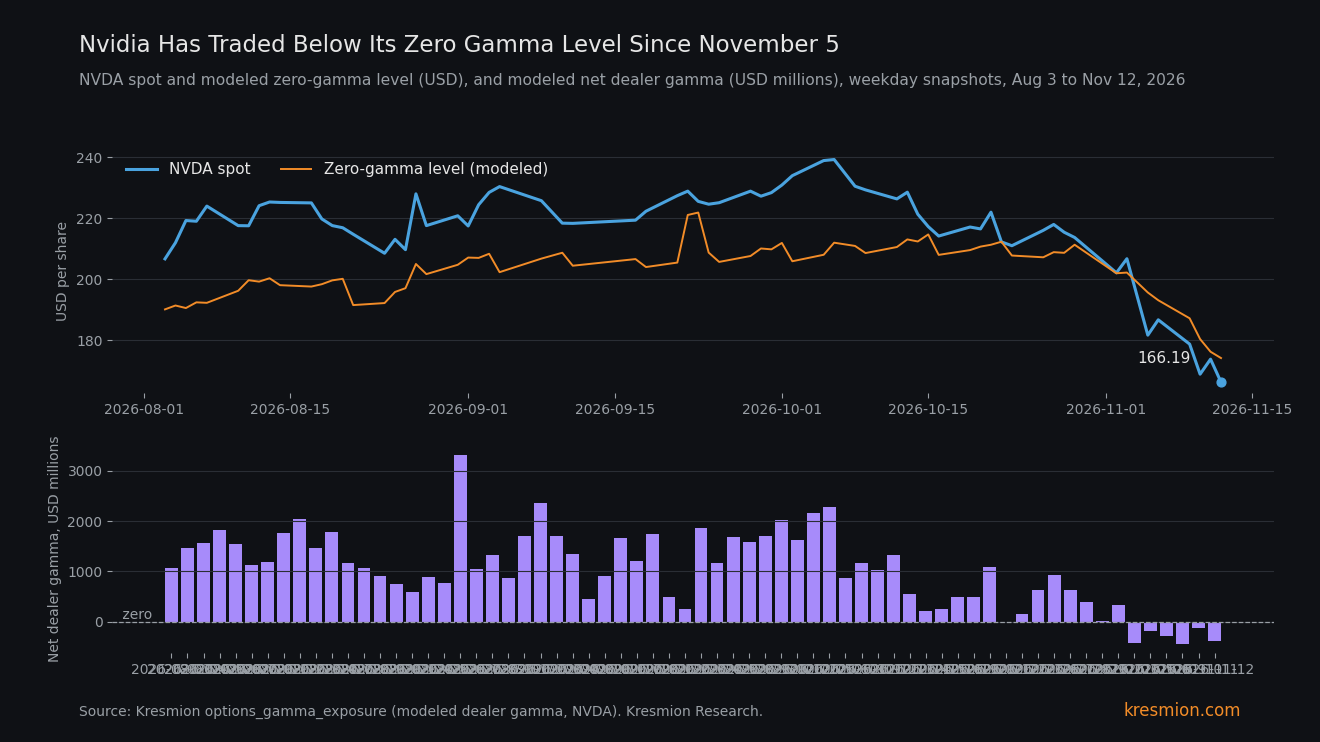
Nvidia closed at 166.19 on Thursday, down 4.34% as its CEO resigned, and our model shows dealer gamma negative since November 5, before Tuesday's earnings. Jensen Huang left as President, CEO and director effective immediately, and CFO Colette Kress is interim CEO while keeping the CFO job. In our options_gamma_exposure model, which assumes dealers are long the calls and short the puts that customers trade, net dealer gamma fell from +920.5M dollars on October 27 to -388.9M on November 12. The fall in that reading came from call gamma shrinking as the price dropped, while put gamma was little changed (1,530.7M to 1,527.7M). That put figure nets price moves, new positions and expiries, so it does not show whether customers added or dropped puts. The data cannot say how large the price effect of any dealer hedging has been or will be.
Key takeaways
| What | Number |
|---|---|
| NVDA close, November 12 | 166.19, down 4.34% from 173.73. Volume 740,019,481 shares, 5.61 times the 50-session average of 131,805,576. The lowest close since March 30 (165.17), not a 52-week closing low (Kresmion company_price_snapshots) |
| Fall from recent highs | -23.74% from 217.94 on October 27, twelve sessions earlier. -30.53% from 239.24 on October 6, the highest close in our one-year window |
| Modeled net dealer gamma | +920.5M (October 27), -415.7M (November 5), -388.9M (November 12). Negative in all six snapshots from November 5 to November 12 (Kresmion options_gamma_exposure) |
| Zero-gamma level | 208.84 on October 27 to 174.09 on November 12. Spot was 4.54% below it on November 12 |
| Call and put gamma, October 27 to November 12 | Call gamma 2,451.2M to 1,138.8M (-53.5%). Put gamma 1,530.7M to 1,527.7M |
| Options-implied move to the November 18 expiry | 9.52%, about 150.37 to 182.01 around 166.19 (Kresmion options_earnings_moves, snapshot November 12) |
| Short interest, October 30 settlement | 279.6M shares, down 7.31% from October 15, 1.16% of shares outstanding, 2.80 days to cover (FINRA via Kresmion) |
What the data shows
The announcement came on November 12. Nvidia said Huang resigned as President, CEO and director effective immediately, that Kress is interim CEO while remaining Executive Vice President and CFO, and that Harvey C. Jones is the company's first Chair. Third-quarter fiscal 2027 results are scheduled for Tuesday November 17 at about 1:20 p.m. Pacific, with the call at 2 p.m., as previously scheduled (SEC 8-K exhibit, NVIDIA Investor Relations).
The stock touched 148.80 intraday and closed at 166.19, with a day range of 148.80 to 167.14 and a 52-week intraday range of 148.80 to 243.37 (Motley Fool). The slide started earlier. NVDA fell 9.26% on November 5, from 200.13 to 181.60, its largest one-day fall since January 27, 2025 (-16.97%).
Our modeled net dealer gamma for NVDA read +920.5M on October 27, +337.8M on November 3, -415.7M on November 5, -175.3M on November 6, -288.1M on November 9, -430.9M on November 10, -113.3M on November 11 and -388.9M on November 12. We have no snapshots for October 30 or November 4. Spot has been below the zero-gamma level in every snapshot since November 5. On that day it was 181.60 against a level of 195.61, 7.16% below. On November 12 it was 166.19 against 174.09.
Before November the reading was never meaningfully negative. In 86 weekday snapshots since late June, the mean is +979.3M with a standard deviation of 707.1M. Eight are negative, six of them the consecutive November readings. The only two earlier negatives were -6.0M (July 29) and -5.0M (October 22), both at the flip level. The latest reading is about 1.9 standard deviations below the mean, and three readings sit at or below it, all in November.
The mechanism
Dealer gamma models assume dealers are long the calls and short the puts customers trade. When a stock sits above most call strikes, call gamma dominates, and the model's dealers hedge against the move: they sell into rises and buy into falls. As NVDA dropped from 217.94 to 166.19, the price moved away from the call strikes. Call gamma shrank 53.5% while put gamma was little changed, so the net turned negative and the zero-gamma level followed the price down.
That has a second-order consequence. The negative reading reflects the price leaving the calls behind, and the put figure cannot show whether customers added or dropped puts, since it nets price moves, new positions and expiries. Under the model's assumption, dealers now hedge in the direction of the move: they buy as the price rises and sell as it falls, which can widen daily ranges.
The strikes matter because of the earnings date. On November 12 the largest modeled net strike exposures were 150 (-102.3M), 160 (-95.5M), 165 (-88.4M), 140 (-71.2M) and 170 (-61.8M), and the largest positive was 185 (+47.1M). These are net-by-strike readings, and the strike table does not sum to the headline net (-594.6M across 64 strikes against -388.9M). Options priced a 9.52% move to the November 18 expiry, about 150.37 to 182.01. That band runs from the largest single strike exposure in the model to just below the largest call-side strike. A reaction inside it would cross the strikes with the largest modeled net exposure, and the monthly expiry on Friday November 20 may then remove part of the modeled put gamma, if the model includes contracts expiring that day. It is also the first report under an interim CEO who is the CFO presenting the quarter.
Other explanations
Price may drive the reading, and the reverse is not shown. A 23.74% fall mechanically pushes spot below the call strikes, so the flip may only describe the decline. The long-call, short-put dealer assumption may also be wrong for NVDA, where customers also sell covered calls.
The news may explain the fall. The resignation came on November 12, but the decline began October 27, and the data cannot say whether the reasons behind the exit were known or leaked earlier.
Market-wide de-risking is a candidate. November 5 was an S&P 500 -4.36% and QQQ -6.49% day, and SPY and QQQ modeled gamma were also negative on November 12 (-6,717.7M and -2,616.1M, with SPY at 757.10 against a flip of 762.61). Against that, the S&P 500 rose 3.25% from November 5 to November 12 (7,353.73 to 7,592.40) while NVDA fell 8.49%. That baseline is the S&P's crash-day close; from the November 4 close of 7,688.62 the index is down 1.25%, and NVDA lags either way. A secondary recap, an AI-assisted one, put the Russell 2000 at -1.66% and the VIX up 6.92% to 18.70 on November 12 (CappNotes).
Rotation within chips fits only part of the data. On November 5, the day NVDA's gamma flipped, AMD fell 17.26% and AVGO 10.43%, more than NVDA's 9.26%, and their modeled gamma was negative too, as were SPY and QQQ. The split came after that: from November 5 to November 12 NVDA fell 8.49% while AMD rose 44.7% and AVGO 25.0%, and AMD and AVGO gamma turned positive on the rebound (+503.2M and +235.0M on November 12). Since October 27 AMD is up 4.47% (560.26 to 585.30) and AVGO 6.44% (342.33 to 364.36). From October 27 to the November 5 close AMD fell 27.8%, NVDA 16.7% and AVGO 14.8%, and on November 5 itself both AMD and AVGO fell more than NVDA. On November 12 AMD rose 5.86% and AVGO 5.54% while SMCI fell 11.30%. Our data does not show what drove any of those moves.
Rates are a weaker fit. The 2-year yield rose 17 bp on November 10, which hits long-duration growth stocks, but AMD and AVGO rose through the same days.
Short interest does not point to shorts as the driver through October 30: FINRA data shows it fell 7.31% to 279.6M shares. That reading predates most of the decline, so it cannot speak to November 5 to 12.
The base rate
A 12-session fall of 23.74% or worse is uncommon for NVDA. In our correlation_close_history series (through November 11, 2026) it occurred in 19 of 4,241 overlapping windows since 2010 (0.45%), clustered in six episodes: March 2011, October 2011, October to November 2018, March 2020, April 2022 and September 2022. None occurred between October 2022 and November 11, 2026. Counting from January 3, 2000 the figure is 130 of 6,744 windows (1.9%), but 111 of those 130 fall in 2000 to 2009, so that figure is dominated by the early 2000s, and the windows overlap heavily. The 2018, 2020 and 2022 episodes went deeper, to -33.66%, -27.68% and -28.27%.
The gamma series is short. The 86 snapshots cover about 4.5 months, so this is not a long base rate. After the seven negative weekday snapshots that have a next session, NVDA's next-session absolute move averaged 3.28% (standard deviation 1.58%), against 1.88% (1.49%) after the 78 non-negative weekday snapshots. Seven observations cannot be separated from the news.
On independence: gamma is derived from the options chain and spot, so it is not independent of price, and part of the flip follows from the fall by construction. We do not treat price and gamma as converging evidence. The price and gamma tables describe one event. The SEC filing and the company site are one corporate source. Short interest is independent but stale. Our screen of gamma across 11 megacap and index tickers sat inside roughly 100 comparisons across desks, so an extreme in any one of them is weak evidence alone. We anchored this note on a dated filing and a scheduled report.
The evidence against
The resignation day itself cuts against a hedging loop. With the biggest news and 5.61 times normal volume, NVDA touched 148.80 and closed at 166.19, 11.7% above the low and near the top of the 148.80 to 167.14 range. The 4.34% fall was less than half of November 5's 9.26%. A loop that sells into falls would not obviously produce that close.
Put gamma was also little changed, from 1,530.7M to 1,527.7M, though that net figure cannot show whether customers added or dropped puts, and short interest fell through October 30, before most of the decline. The negative reading may describe where the price sits against the strikes more than any active selling.
What would change the read
- Tuesday November 17: Nvidia reports at about 1:20 p.m. Pacific, its first report under an interim CEO (SEC 8-K exhibit).
- Wednesday November 18: the options expiry that priced the 9.52% move. The Fed's October minutes are the same day (LiteFinance calendar).
- Friday November 20: the monthly options expiry, which may remove part of the modeled put gamma at the 150 to 170 strikes, if the model includes contracts expiring that day.
- Our daily snapshot: net gamma back above zero, or a close above the zero-gamma level (174.09 on November 12), ends the negative-gamma state in the model.
- Mid-November FINRA short interest, published in late November (exact date not confirmed by us), shows whether shorts rose after the CEO news.
Our table has no NVDA rows in insider_trades after September 21. The NVDA close on November 12 was 166.19.
Frequently asked questions
What does negative dealer gamma mean?
In the model, dealers are long calls and short puts. When net gamma is negative, their hedges run in the direction of the price move: they sell as the stock falls and buy as it rises. Our model uses an assumption about who holds which options, and it may be wrong for NVDA.
Did put buying push Nvidia's gamma negative?
The model cannot tell. Put gamma was 1,530.7M on October 27 and 1,527.7M on November 12, and the fall in net gamma came from call gamma, 2,451.2M to 1,138.8M (-53.5%), as the price moved below the call strikes.
Is Nvidia's fall unusual?
A 23.74% fall over 12 sessions occurred in 19 of 4,241 overlapping windows since 2010 (130 of 6,744 since January 2000, mostly in the early 2000s), and none has occurred between October 2022 and November 11, 2026. The November 5 one-day fall of 9.26% was the largest since January 27, 2025.
Are short sellers behind the decline?
FINRA data to the October 30 settlement shows short interest down 7.31% to 279.6M shares, 1.16% of shares outstanding. It predates the November 5 and November 12 moves, so it cannot speak to them.
When does Nvidia report, and who presents?
Tuesday November 17, results at about 1:20 p.m. Pacific and the call at 2 p.m., as previously scheduled. Kress is interim CEO and remains CFO. Our NVDA research page, kresmion.com/research/NVDA, is an institutional-holdings and SEC-filings page (last price 166.19 as of November 12); it has no NVDA gamma data.
Sources
SEC, NVIDIA Announces CEO Transition (8-K exhibit): Huang resignation, Kress interim CEO and CFO, Jones as Chair, Q3 FY2027 results on November 17.
NVIDIA Investor Relations, NVIDIA Announces CEO Transition: the same announcement on the company site.
Motley Fool, Stock Market Today, November 12: NVDA intraday range 148.80 to 167.14 and 52-week range 148.80 to 243.37.
CappNotes, Closing Look, Thursday November 12: secondary, AI-assisted recap used only for the Russell 2000 and VIX moves.
LiteFinance, weekly economic calendar for November 16 to 22, 2026: Fed October minutes on Wednesday November 18.
Kresmion, NVDA research page: institutional holdings and SEC filings page (last price 166.19 as of November 12, latest filing an 8-K dated November 12), with no NVDA gamma data. Figures in this note come from our company_price_snapshots, options_gamma_exposure, options_earnings_moves, correlation_close_history and short_interest tables.