
By Kresmion Research, November 17, 2026
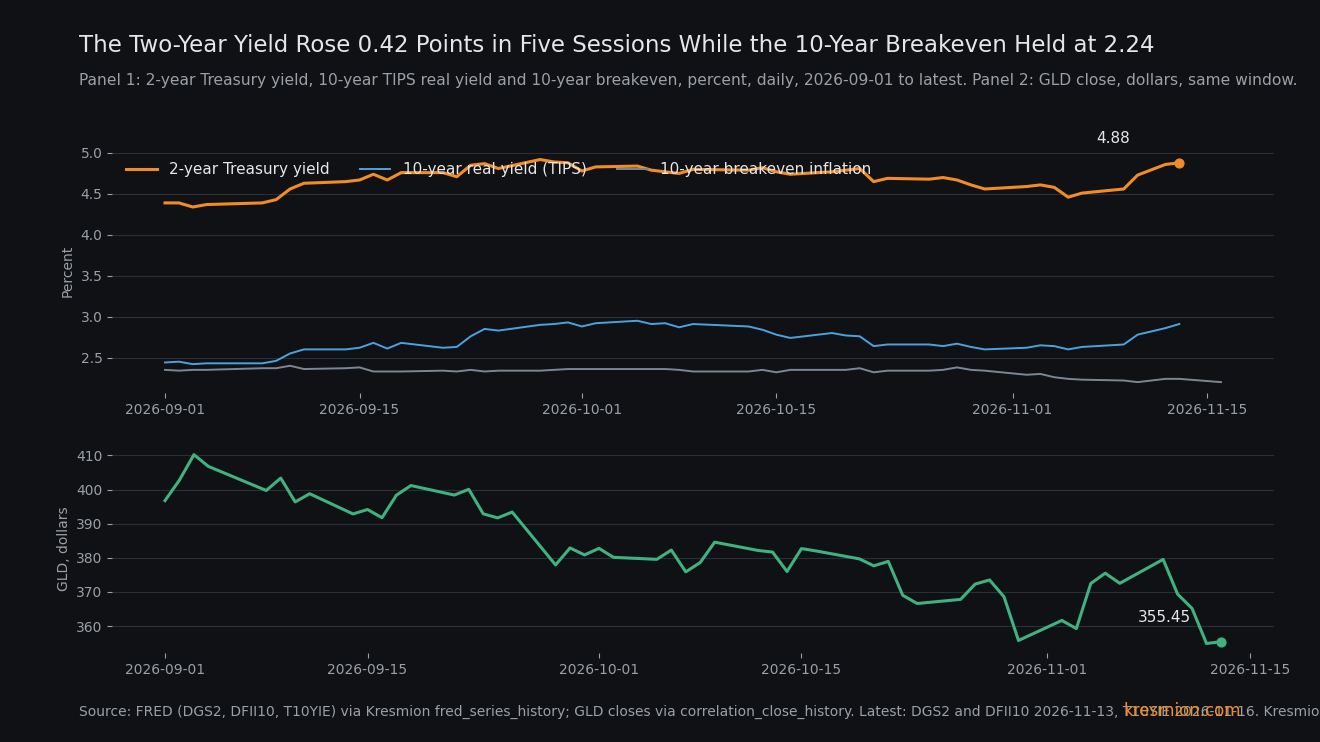
The two-year yield rose 42 basis points in five sessions to 4.88 percent on November 13, the most since June 2022, and the 10-year breakeven ended unchanged. The breakeven is the inflation rate the bond market prices over ten years. It was 2.24 percent on both November 5 and November 13, while the 10-year real yield, the return after inflation, rose 31 basis points. Gold, which pays no yield, fell 5.52 percent over the same window. Two caveats come first: the window starts at a one-day haven low, so from November 4 the rise is 30 basis points, and the two-year level of 4.88 is below its September 28 level of 4.92.
Key takeaways
| What | Number |
|---|---|
| Two-year Treasury yield (DGS2) | 4.46 percent on November 5 to 4.88 on November 13, +0.42 points over five observations (FRED via Kresmion fred_series_history) |
| Base rate since 2000 | 19 of 6,720 five-observation windows (including this one) rose at least 0.42 points, about 0.28 percent, in about 10 episodes. The last before this one ended on June 15, 2022 (fred_series_history) |
| 10-year nominal, real, breakeven | Nominal 4.84 to 5.15 (+31 bp). TIPS real yield 2.60 to 2.91 (+31 bp). Breakeven 2.24 to 2.24 (FRED) |
| Releases in the window | October payrolls 165,000 against a 65,000 forecast (November 6). October CPI +0.4 percent against 0.3 forecast, core +0.3 against 0.2 (November 10) (macro_calendar_events) |
| Gold | Futures 4,113.50 to 3,886.30, -5.52 percent. GLD 375.49 to 355.45, -5.34 percent over six sessions. Reuters put Monday's spot low at 3,830.74 |
| Gold and real yields | Correlation of 5-day moves: -0.02 in 2025, -0.40 in 2026 (217 overlapping observations) |
What the data shows
Our fred_series_history table (queried November 17, latest DGS2 observation November 13) has the two-year at 4.46 percent on November 5, then 4.51 on November 6, 4.56 on November 9, 4.73 on November 10, 4.86 on November 12 and 4.88 on November 13. There is no November 11 row because of Veterans Day, so the 13 basis point step on November 12 spans two calendar days. The daily steps were +5, +5, +17, +13 and +2.
Our macro_calendar_events table shows the two releases that fell inside the window. October nonfarm payrolls printed 165,000 on November 6 against a forecast of 65,000, with unemployment at 4.1 percent against a forecast of 4.2. October CPI on November 10 rose 0.4 percent against a 0.3 forecast, and core rose 0.3 percent against 0.2. FRED's CPIAUCSL index for October is 337.476, up 0.35 percent from September's 336.298. Our copy has no October 2025 index, so we do not quote a year-on-year change. The Fed's target range upper bound rose from 3.75 to 4.00 percent, effective September 17, the only change this year. Reuters reported on November 16 that CME FedWatch implied a 25 basis point December hike with a small chance of 50. The Weekend Spread put the chance of a 25 basis point hike above 93 percent that morning.
The 10-year Treasury yield went from 4.84 to 5.15 percent. The 10-year TIPS real yield went from 2.60 to 2.91, the same 31 basis points, and the breakeven did not move. The 30-year rose 22 basis points, from 5.25 to 5.47, so the 2s10s spread narrowed from 0.38 to 0.27 points. Monday's closes, per The Weekend Spread, were 5.115 percent for the 10-year and 4.819 for the two-year, down 4 and 5 basis points.
Gold futures (GC=F, futures_prices) went from 4,113.50 on November 5 to 3,886.30 on November 13. GLD fell from 375.49 to 355.45 over six sessions, because stocks traded on November 11. Reuters reported spot gold at 3,830.74 on Monday, the lowest since October 2, 2025 and 31.5 percent below its January record of 5,594.82. Gold futures settled at 3,851.80 on Monday and traded at 3,876.60 at 05:02 UTC today (commodity_prices). The dollar index went from 101.55 to 103.41, up 1.83 percent (correlation_close_history).
The mechanism
Two data surprises fell inside the window, and the CPI day carried the largest step (+17 bp). On payrolls day the two-year rose only 5 bp, and 20 of the 42 basis points came on days without payrolls or CPI, so the data cannot say how much of the rise the surprises explain. The two-year yield is the maturity most tied to the expected Fed path, so it is where a repricing would show first. Longer yields moved less, which is why the curve flattened. At the 10-year point the entire rise came through the real yield, and the breakeven stayed at 2.24. The real yield rose and the inflation estimate did not, which fits a firmer expected Fed response with inflation compensation unchanged. One reading is that investors treated the hot prints as a reason to expect tighter policy.
The second-order point is about gold. A higher real yield raises the cost of holding an asset that pays nothing. In our correlation_close_history table joined to DFII10, the correlation of 5-day GLD log returns with 5-day changes in the 10-year real yield was -0.023 across 248 observations in 2025 and is -0.40 across 217 observations in 2026. Since August 17 it is -0.424 across 62 observations. In 2015 to 2024 the yearly figure ranged from -0.19 to -0.77, so 2025 was the outlier and 2026 looks like a return to the older relationship. Gold is again trading against real rates, which makes its drop a partial second readout of the same Fed repricing and a weak independent haven signal this week. A correlation of -0.40 means real yields account for roughly 16 percent of the variance in 5-day gold moves, so it is a partial reading, not a full one. These windows overlap, so the yearly figures overstate their precision.
Other explanations
Haven unwind. On November 5 the two-year fell 12 basis points, from 4.58 to 4.46, as stocks fell (our note of November 6 covered that day). Part of the 42 basis points is that bid reversing. From November 4 the rise is 30 basis points over six observations, the real yield rose 27 basis points from 2.64, and the breakeven fell 0.02 from 2.26.
Energy-driven inflation fear. The 10-year breakeven did not widen (2.24 to 2.24, 2.20 on November 16), which argues against a long-horizon scare. Our data has no 1-year or 5-year breakeven, so it cannot test a short-horizon one.
Gold has its own candidates. The dollar index rose 1.83 percent. Reuters quotes MKS PAMP calling gold a "liquidity asset" in the short term, which fits selling to raise cash after equity losses (the S&P 500 fell 4.36 percent on November 5, per our November 6 note), although the S&P 500 rose between November 5 and November 12 while gold fell, which weakens this reading. That would not explain Monday alone, since most of gold's fall came before it. Reuters also reports central banks bought 675 tons from January to September (World Gold Council), that gold ETFs took in 211 tons in Q3, and that Poland reached its 700-ton target. These overlap, and the data cannot say how much of gold's fall came from real yields, the dollar or cash raising.
Positioning. In the CFTC report for November 10, speculators held a gold net long of 190,107 contracts, 46.97 percent of open interest of 404,725, up from 179,548 on November 3 and below the 243,334 peak of August 25 (cot_reports). That report predates most of the gold fall. Modeled dealer gamma in GLD was -1.004 billion dollars on November 16, with spot at 352.90 below the zero-gamma level of 365.59. Of 56 snapshots since August 19, 19 were negative and 1 was lower (-1.037 billion dollars on November 12), which implies dealer hedging could add to any rate-driven move.
The base rate
Since January 1, 2000, 19 of 6,720 five-observation windows in DGS2, including this one, rose at least 0.42 points (rounded to two decimals), about 0.28 percent. They cluster in about 10 episodes: April and November 2001, March 2002, March, April and June 2008, June 2009, February and June 2022, and this one. The last before November 13 ended on June 15, 2022. The standard deviation of the five-observation change since 2000 is 0.1164 points, so 0.42 is about 3.6 standard deviations. Over FRED's full history from June 1, 1976, 205 windows qualify, mostly from 1978 to 1987. A four-observation window from November 6 gives 0.37 points, which 23 four-observation windows since 2000 matched or exceeded (sd 0.1048).
A flat breakeven is common in fast two-year moves. The 12 earlier five-observation windows since 2003 with a rise of at least 0.42 overlap and form about six episodes. In them the 10-year breakeven moved between -0.13 and +0.19 points. In the June 2022 windows it fell between 0.02 and 0.13 while the real yield rose between 0.35 and 0.64. So the split is ordinary for a Fed repricing.
For gold, GLD's six-session return of -5.34 percent was matched or beaten in 128 of 5,526 windows since late 2004, including this one (2.3 percent; sd 2.77 percent). The most recent before November was September 28, 2026. It is unusual across the long history and routine in 2026, so gold's move is ordinary for this year and the yield move is not. The 10-year real yield of 2.91 has been matched or exceeded on 8 days since 2009, with a maximum of 2.95 on October 5, 2026.
This note comes from a screen of about 15 findings across many tables, and we ran about 30 queries on this one. With that many comparisons, a 1-in-350 event surfaces by chance, so we lean on the long FRED history. The window start was picked after seeing the data, and we report the November 4 and November 6 starts alongside.
The evidence against
The two-year level is not extreme. At 4.88 it sits below its 2026 peak of 4.92 on September 28, and it was at or above 4.88 on 4 days in 2026, the last before November 13 being September 30. The move began at a one-day haven low. On Monday the two-year fell 5 basis points after the Empire State index printed 7.8 against an 18.0 forecast, and the breakeven eased to 2.20. The PPI on November 13 came in at 0.3 percent against a 0.4 forecast. Read that way, the bond market round-tripped a haven bid and by November 13 stood within 4 basis points of its September 28 level.
On gold, the November 10 CFTC report shows speculators adding longs that week (long side 220,530 to 226,234), but the net long was already 21.9 percent below its August 25 peak of 243,334, and the report predates most of the fall, so it cannot show whether the rate-driven move brought an exit. A six-session fall of this size last happened on September 28.
What would change the read
October retail sales come today at 8:30 ET (DB consensus +0.2 percent, prior +0.8). A weak print with a falling two-year would favor the haven-and-growth reading over the Fed-path reading. Governor Waller speaks at 9:10 ET, and the October FOMC minutes arrive Wednesday at 2:00 pm ET. FRED's November 16 and 17 prints for DGS2 and DFII10 matter next: if the real yield passes its 2.95 October high while the breakeven stays near 2.20 to 2.24, the real-yield channel strengthens, and if the breakeven widens instead, the inflation-fear reading gains. The CFTC report for November 17, released Friday November 20, will show whether the gold net long of 190,107 fell. A two-year close below 4.58, its November 4 level, would erase the data-driven part of the move. The two-year closed at 4.819 percent on Monday, per The Weekend Spread.
Frequently asked questions
Did inflation expectations rise?
Not in the 10-year breakeven, which was 2.24 percent on November 5 and on November 13 and 2.20 on November 16. The 31 basis point rise in the 10-year yield came through the real yield, from 2.60 to 2.91 percent.
How rare is a 42 basis point rise in the two-year yield?
Since 2000, 19 of 6,720 five-observation windows, including this one, rose at least that much, about 0.28 percent, in about 10 episodes. The last before this one ended on June 15, 2022. Measured from November 4 the rise is 30 basis points.
Why did gold fall?
Gold pays no yield, so higher real yields make it costlier to hold. Its 5-day correlation with the 10-year real yield is -0.40 in 2026 against -0.02 in 2025. The dollar and cash raising also fit, and they overlap with real yields.
Is gold's drop a haven signal?
Gold's fall looks like a partial second readout of the same Fed repricing, since gold is trading against real rates again. A six-session drop of 5.34 percent in GLD is also ordinary for 2026.
What is next?
Retail sales and Governor Waller today, the FOMC minutes on Wednesday November 18 at 2:00 pm ET, and the CFTC report on Friday November 20.
Sources
FRED, DGS2, 2-Year Treasury Constant Maturity: provenance of the two-year series. Numbers come from Kresmion's fred_series_history copy, latest observation November 13; we did not fetch this page.
FRED, DFII10, 10-Year TIPS real yield: provenance of the real-yield series and the 2.95 high of October 5; numbers from fred_series_history.
FRED, T10YIE, 10-Year Breakeven Inflation Rate: provenance of the breakeven series, 2.24 on November 5 and 13, 2.20 on November 16; numbers from fred_series_history.
FRED, DFEDTARU, Fed funds target range upper limit: the rise from 3.75 to 4.00 percent, effective September 17, 2026; numbers from fred_series_history.
Reuters via KELO, November 16, 2026: gold low of 3,830.74, 31.5 percent below the January record, FedWatch December hike, central bank and ETF demand, Poland.
The Weekend Spread, The Close: Monday, November 16, 2026: Monday closes for the two-year and 10-year, gold settlement, FedWatch above 93 percent, and the Tuesday calendar.
Kresmion note, November 6, 2026: the November 5 haven low that starts this window.